E-learning analytics software records what a learner did in a product the company already runs, and turns those events into reports a product, content, or training team can act on. Custom development is the right commission when the events, the roles, and the questions do not fit a packaged dashboard. A completion checkbox is a different buy. A model that changes the next lesson is a different buy.
Shakuro builds this as e-learning web development for companies that run a learning product and need the reporting layer to match their own events. The work sits in e-learning software. If the event list and the first questions are already written down, write to us with that list. We scope the first release from it. We do not quote a universal price, and we do not treat a dashboard design as a shipped analytics system.
A chart does not improve learning. It shows where people stopped, how they scored, and who came back. What to change in the lesson is a content decision. A completion-rate promise does not belong in the proposal.
For those who prefer to listen rather than read, this article is also available as a podcast on Spotify.
What Is Data Analytics in eLearning?
Data analytics in e-learning is the set of events, definitions, and reports that answer questions across courses, cohorts, and time. It is the reporting layer on a learning product. It is not the course player, and it is not the enrollment record.
The useful unit is an event with a name the team agreed on: a lesson started, a lesson completed, a video position, a quiz attempt, a quiz submitted. “Time on page” is not a metric until someone writes how idle time is cut. A tab left open is not study.
| Situation | What to commission |
| Questions across courses, cohorts, and time. The events and the definitions belong to the company. | This reporting layer. This page. |
| Who finished this course, enrollment, and the attempt record. | An LMS development project, or the LMS the company already runs. The chart on this page is only as good as that record. |
| Assignment by role, and a completion record for employees. | A corporate training platform. Reports that go past who finished are a later scope, not the first release of that platform. |
| A model that changes the next lesson, or that drafts feedback for an instructor to review. | An AI-powered learning platform. Activity in a report is not proof the model improved learning. |
| A public catalog that sells courses. | An online course platform. Buying a ready-made catalog is a purchase, not this build. |
| Many providers selling courses to learners. | An edtech marketplace. Not a reporting layer on one product. |
| The product is sold to many schools, each of which must not see the others’ learners. | An educational SaaS platform. The tenant boundary is a different estimate. Do not hide it inside the first dashboard. |
| A packaged report already answers the questions. | Do not commission this. A custom chart on top of a report that already works is a cost, not a product. |
A data-driven learning system, in the sense of this page, means the team can point at an event and a definition when they make a product decision. It does not mean a model is choosing the next lesson. That boundary is the row above.
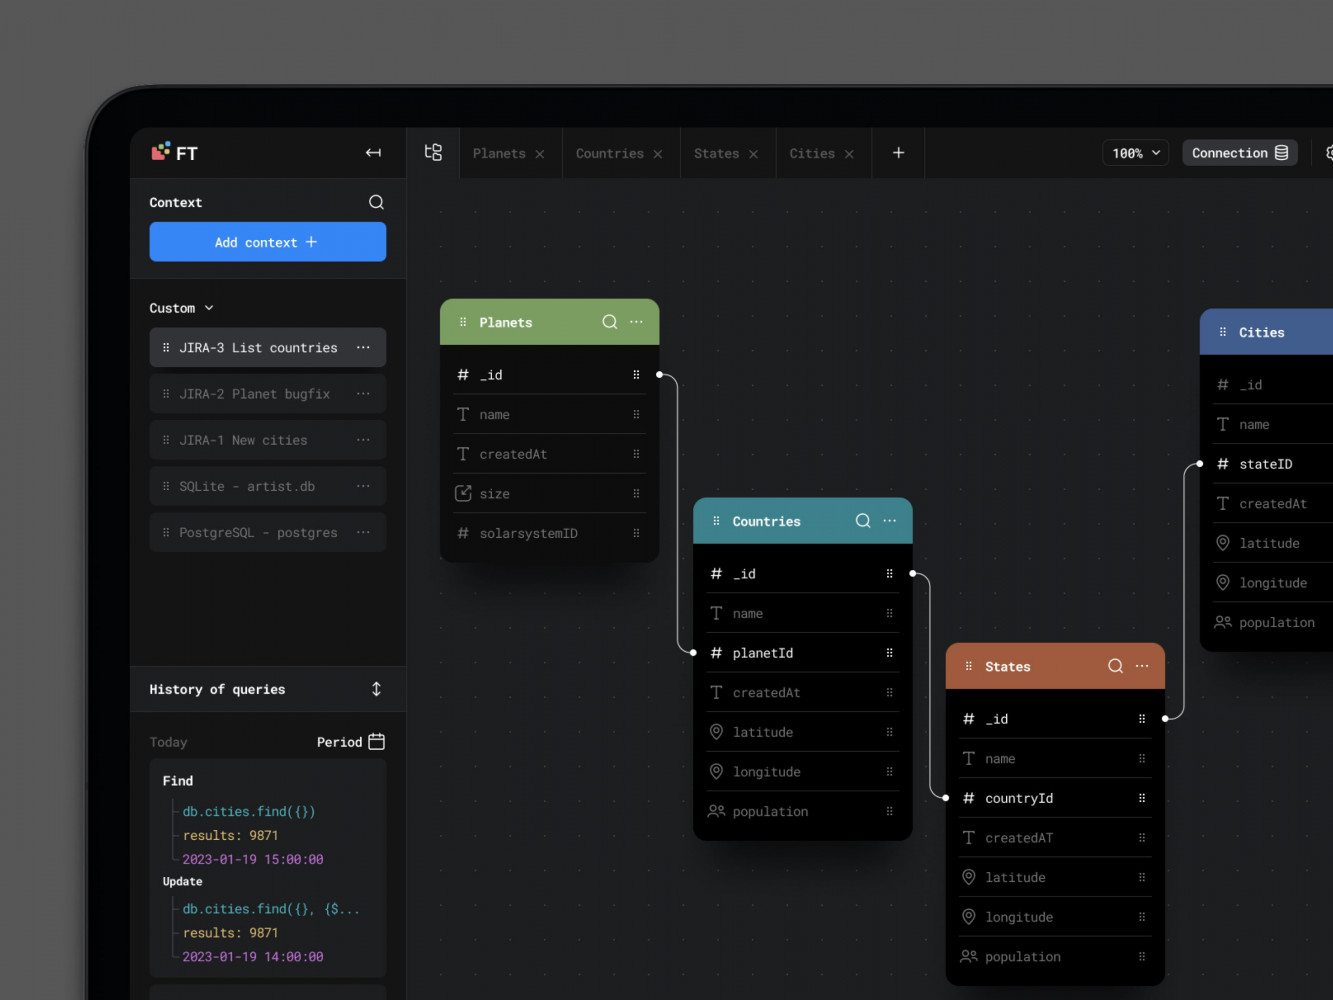
Database Visualisation Web Design by Conceptzilla
The frame above is a database visualisation design. It is not a learning analytics product, and it is not evidence that an analytics system has been shipped.
Key Features of eLearning Analytics Platforms
Features are the questions the first release must answer, not a catalog of charts. If a feature does not change what is stored, or what a named role can see, it waits.
User Behavior Tracking
Behavior tracking is the event log: what was opened, in what order, and where the person left. It does not say whether they learned the material.
Agree the names before the build. A short first list is enough:
- lesson started, lesson completed
- video played, video paused, with a position rather than a click alone
- quiz attempt started, quiz submitted, with the item id and the attempt number
- session ended, including a reason if the client actually knows it
Adding twenty more events before those are defined is how the log becomes noise. A mouse-move stream is not on this list. Store what the questions need.
The attempt record usually lives in the LMS. If that record is wrong, a richer chart repeats the error. Events from a phone are the same events. The app itself is a mobile learning platform question, not a second analytics product.
Learning Performance Analytics
Performance analytics is the result next to the event: the score, the attempt number, pass or fail, and which item was missed. It separates presence from a result. A learner can open every lesson and still miss the same item. A section can have less activity and still have a clean pass rate. Those are two different facts. Neither one is an automatic rewrite of the lesson.
When many people miss the same item, the report shows the cluster. Whether the cause is the explanation, the sequence, or the item itself is a review by the person who owns the content. The software does not make that call, and it does not raise a score.
Built-in assessment analytics means the attempt, the item, and the score are in the same record the dashboard reads. A spreadsheet exported once a term is a different workflow. Do not brief both as the same release. A generated score, if a later product drafts one, is not the only basis for a consequential decision. The AI learning article covers that limit. This page covers the record the reviewer inspects.
Engagement and Retention Analysis
Engagement is whether people come back and keep moving. The useful fields are return visits, unfinished modules, and a break that lasts longer than the pattern for that cohort. One missed day is not a pattern.
Retention is the same log read from the other end: who stopped, after which step, in which cohort. A drop after the first quiz is a different problem from a drop after week three. The report should be able to show that split. It should not invent a reason, and it should not predict who will leave. A forecast is a later scope, named in the engine section.
A reminder, a changed sequence, or a support offer is a product decision with its own estimate. Those actions are not included because a chart exists. A path that changes because a model scored the learner belongs on the AI learning page, not here.
Real-Time Analytics
An e-learning platform with real-time analytics is a scope decision, not a default feature of every learning product.
Live numbers are worth the cost when someone can act the same day. A live class, a timed exam, a cohort that starts together, or a quiz that starts failing after a content push are the usual cases. A weekly edit of a lesson does not need a live stream. A scheduled report is enough, and it is a smaller build.
Real-time does not replace the definitions. A live counter of open tabs is still not study. The infrastructure for a large event stream is a real-time data processing question. Name it only when the volume makes ordinary service-to-service calls lose events. Do not add a broker to the first release because the word “real-time” appeared in a workshop.
Custom Dashboards and Reporting
An instructor, an admin, and a program owner do not ask the same question. The instructor wants who is stuck in this cohort and which item was missed. The admin wants completion and activity by group. The program owner wants the same numbers by department, site, or program. Three roles can share one data set. They should not share one screen if the questions differ.
A chart that needs a paragraph of legend will not be used. Filters have to match the questions in the brief: cohort, course, date, and role. Extra filters are a later pass. A learner, if they see a screen at all, sees their own record. They do not see someone else’s score.
Interactive views with those filters are a frontend problem. React development is a practical choice when the view has to update without a full reload. The library does not fix a vague metric.
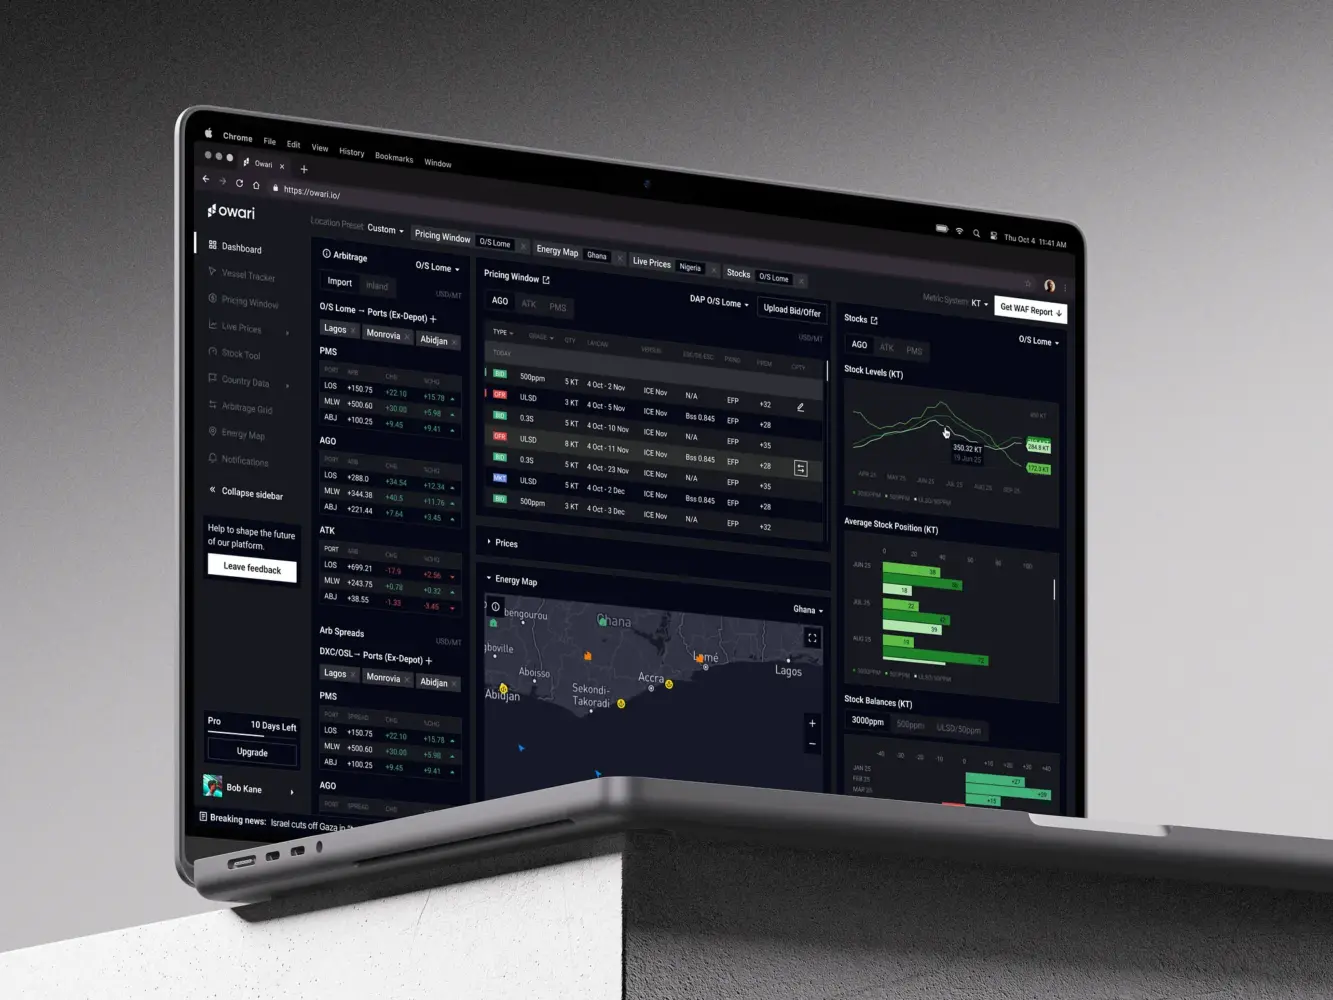
Dashboard Design for Stock Trading Platform by Shakuro
The frame above is a dashboard design for a stock-trading product. It is not a learning analytics screen. We are not offering it as EdTech work.
Data Analytics Platform Development Process
The work starts with the questions, not with the chart. If the platform is not storing the events those questions need, a well-drawn dashboard will still be empty in the places that matter.
1. Data Strategy and KPI Definition
Write the questions before the events. A corporate training desk cares about who is overdue on a required course. A course business cares about who paid and who finished. An academic system cares about the attempt record. Those are three briefs. Do not paste them into one metric list and call it a strategy.
A useful first set is small. Completion, as you defined it. Drop-off by step. Quiz result by item. Return within a window you named. “Engagement” is not a KPI until it is one of those. Department and role, if the report needs them, come from the employee record in HR software. This layer reads that record. It does not become the HR system.
If nobody can write the four questions, the project is not ready to estimate. A workshop that produces a chart wishlist is not a brief.
2. UX/UI Design for Analytics Dashboards
Design the view from the question, not from a chart library. One role, one screen, the filters that role is allowed to use. A manager sees their group. An admin sees the program. Mixing those two on the first screen is how a useful number gets buried.
The frames in this article are design work for other products. They show how a dense table can be made readable. They are not a specification for this dashboard, and they are not a case study of a learning product.
3. Choosing the Technology Stack
Pick the stack from the job. A metric that runs on a schedule can live next to the application database while the volume is small. A separate analytical store is a later move, when the same queries start slowing the product people are trying to use.
A message stream is justified when events are too many to pass from service to service without loss. That decision belongs with the real-time section above. Do not specify a broker in the first estimate because a diagram had a box for it.
A model is a different commission. AI development covers a model that scores or classifies events. It is not the first release of this reporting layer. A model score is not evidence that learning improved, and this page will not print a lift, a percentage, or a before-and-after.
4. Data Pipeline and Architecture
The pipeline is the path from the event in the product to the row the report reads. Names have to stay stable. lesson_completed in March and lesson_finished in June are two metrics, not one history.
A learning product does not need huge traffic to get messy. Multiple courses, repeated attempts, and a role filter are enough. The practical rules are short: one name per event, a timestamp the team trusts, an id that ties the event to a person and a course, and a rule for a duplicate post.
The wider architecture of a data pipeline is its own article. Use it when the path has more than one source. Do not start there if the only source is the learning product itself.
5. Analytics Engine Development
The engine is the calculations: completion as defined, drop-off by step, quiz result by item, return within the window. Some run on a schedule. Some run when a person opens the dashboard. Say which, because the cost is different. A number that is an hour old is acceptable for a weekly content edit. It is not acceptable for a timed exam. Write that down in the brief so the estimate matches the job.
Cohorts are a filter on those calculations, not a new product. Forecasting who might leave is a later scope. The architecture for that kind of model sits in predictive analytics systems. Do not put it in the first release because a slide said “predictive.” A forecast is also not a learning effect. It is a score the team still has to interpret.
6. Testing and Data Validation
Test the numbers against the source rows, not against a screenshot. Pick a cohort the team can count by hand. The report must match that count. If it does not, the dashboard is not ready, however finished it looks.
Check three failures before launch. The same attempt posted twice must not become two attempts. A timestamp in the wrong zone must not move a completion into the next day. A completion must not be recorded when the person only opened the lesson. If any of those pass, people will argue with the number, and the argument will be correct.
7. Deployment and Scaling
Ship the scheduled report first if nobody acts the same day. Add the live view when a live class or a timed exam is actually in the brief. Scaling is a response to volume you can measure, not a cluster drawn in the proposal.
After launch, event names will be wrong in places the brief did not expect. Budget a correction pass. That pass is part of the work. It is not a surprise line with no scope, and this page still does not print a price for it.
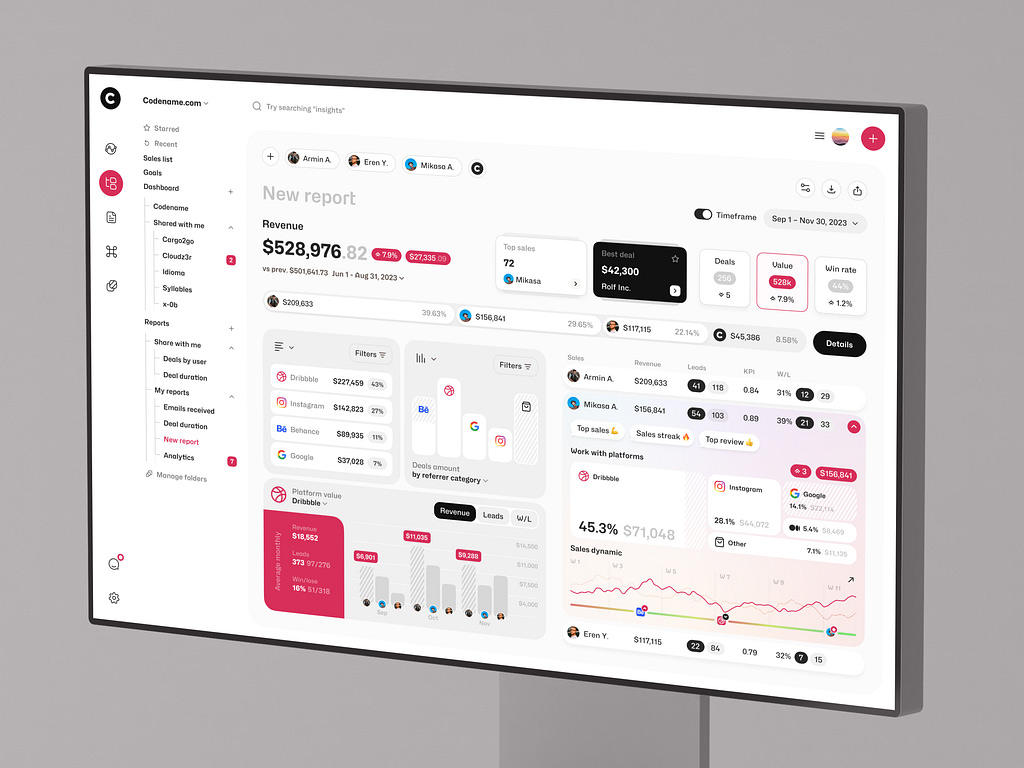
Sales Analytics Dashboard by Shakuro
The frame above is a sales dashboard design. It is not a learning analytics screen.

Cost of eLearning Analytics Platform Development
The cost follows the scope. There is no honest universal number, and this page will not invent one. A daily rate, a month count, and a dollar range would all be fiction here.
| What is in the brief | What changes the estimate |
| Events and how long they are kept | A short list stored for a term is smaller than every click stored for years. |
| Source systems | One learning product is smaller than a learning product plus HR, payments, and a second school. |
| Refresh | A nightly report is smaller than a live view someone must act on the same day. |
| Depth | Counts and a pass rate are smaller than cohorts, and both are smaller than a model. |
| Who may see a score | One role is smaller than instructor, admin, program owner, and the learner’s own view, each with a different filter. |
| Who checks the report | A named person comparing a cohort to source rows is part of the work. A screenshot review is not. |
A basic dashboard on events the product already stores is a smaller commission than a separate store, a live stream, and a model. The calculator below is a way to sketch a team. It is not a quote.

Bring the event list, the first questions, and what the first release will not include. Get in touch with that list. We will say whether this layer is the right commission before anyone draws a chart.
Common Challenges in eLearning Analytics Development
The hard part is not drawing the chart. It is agreeing what the number means, and keeping that meaning after the product changes.
- Volume. Lesson views, pauses, and repeated attempts multiply faster than a completion count. Store what the questions need. Do not store every mouse move because a template had the field.
- Definitions. Two teams using “complete” for different actions will not share a report. Write the definition next to the event name, and keep it when the content editor changes.
- Live versus scheduled. A live view that nobody watches is a cost. The real-time section above is the test: can someone act the same day, or not.
- Privacy. A score is personal in most products. Name what is stored, who can see it, and how long events are kept. Counsel decides the legal basis. We do not switch compliance on. If statements must leave the platform for another system, Caliper Analytics is one published vocabulary for learning activity. Agree it before the build, or do not exchange the statements.
- Trust. A number the content owner cannot check against a known cohort will not be used. That is a product failure, not a training problem for the reader of the dashboard.
Our Experience in Data and EdTech Development
The published work we will stand behind on this page is not a shipped e-learning analytics system. It is design and web work where the hard part was making dense information readable. Saying otherwise would turn a picture into a case the case page does not describe.
Experience with Data-Heavy Platforms
Multifamily Modeling consults multifamily investors and builds Excel-based financial models. The published case is a rebrand and a website. The services on that page are branding and UI/UX design. The challenge they name is presenting Excel tables so a person can read them. That is the overlap with a learning dashboard: a dense table has to stay readable. It is not an analytics engine, and it is not an EdTech product.
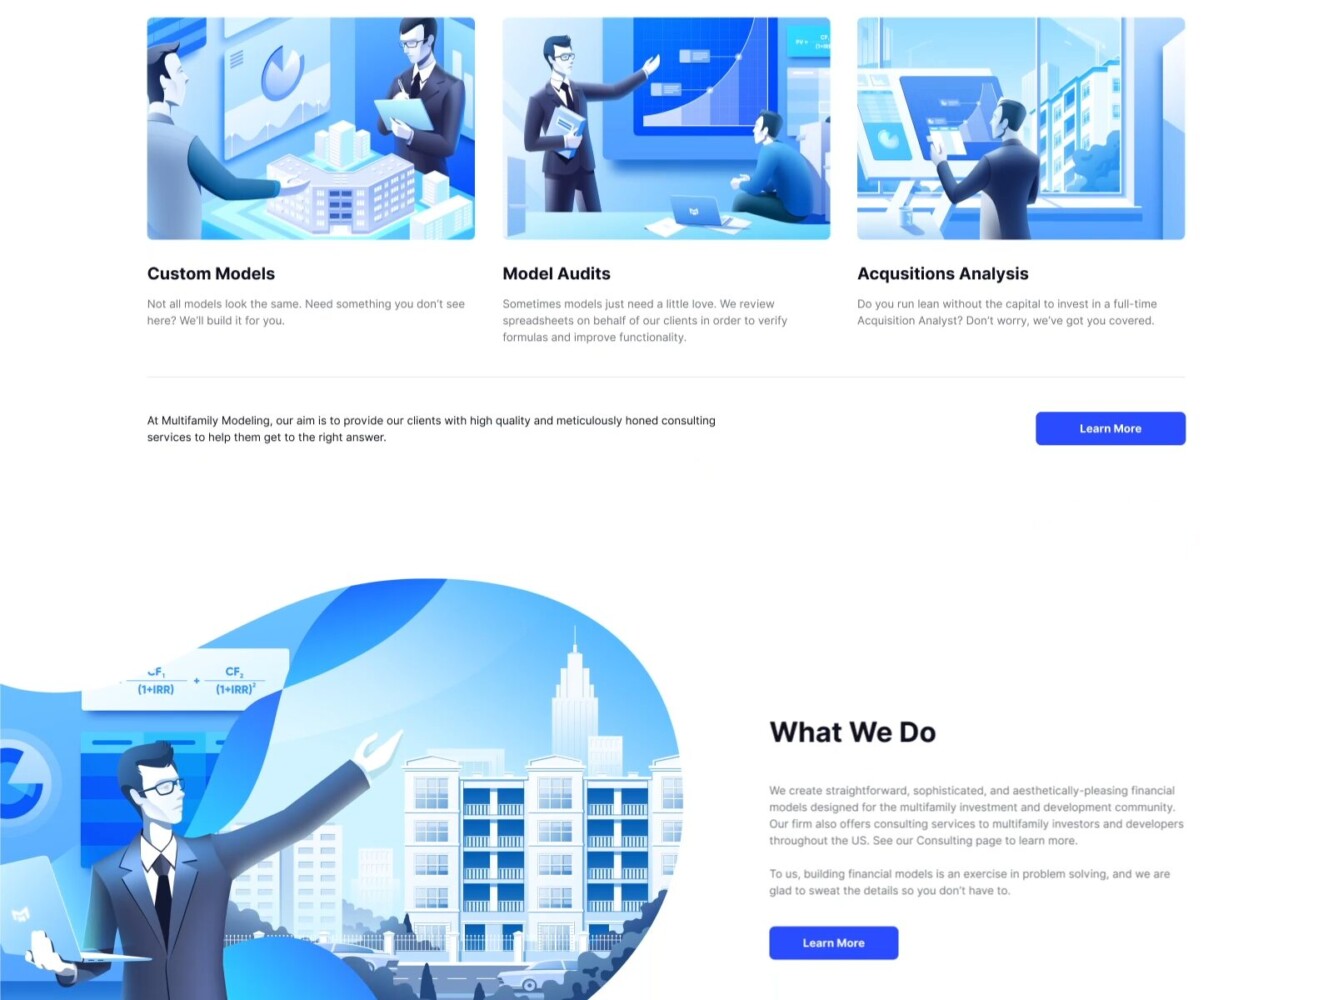
Multifamily Modeling Design by Shakuro
Builddie is a smart home company. The published case says we designed and developed a promotional website, and worked on a management platform with a smart home interface and an energy monitoring dashboard. The services listed are UI/UX design and web development. The website used a Node.js back end. That dashboard is about household energy, not learners. We are not offering it as a learning analytics system, and we are not offering the energy screen as proof of an EdTech build.
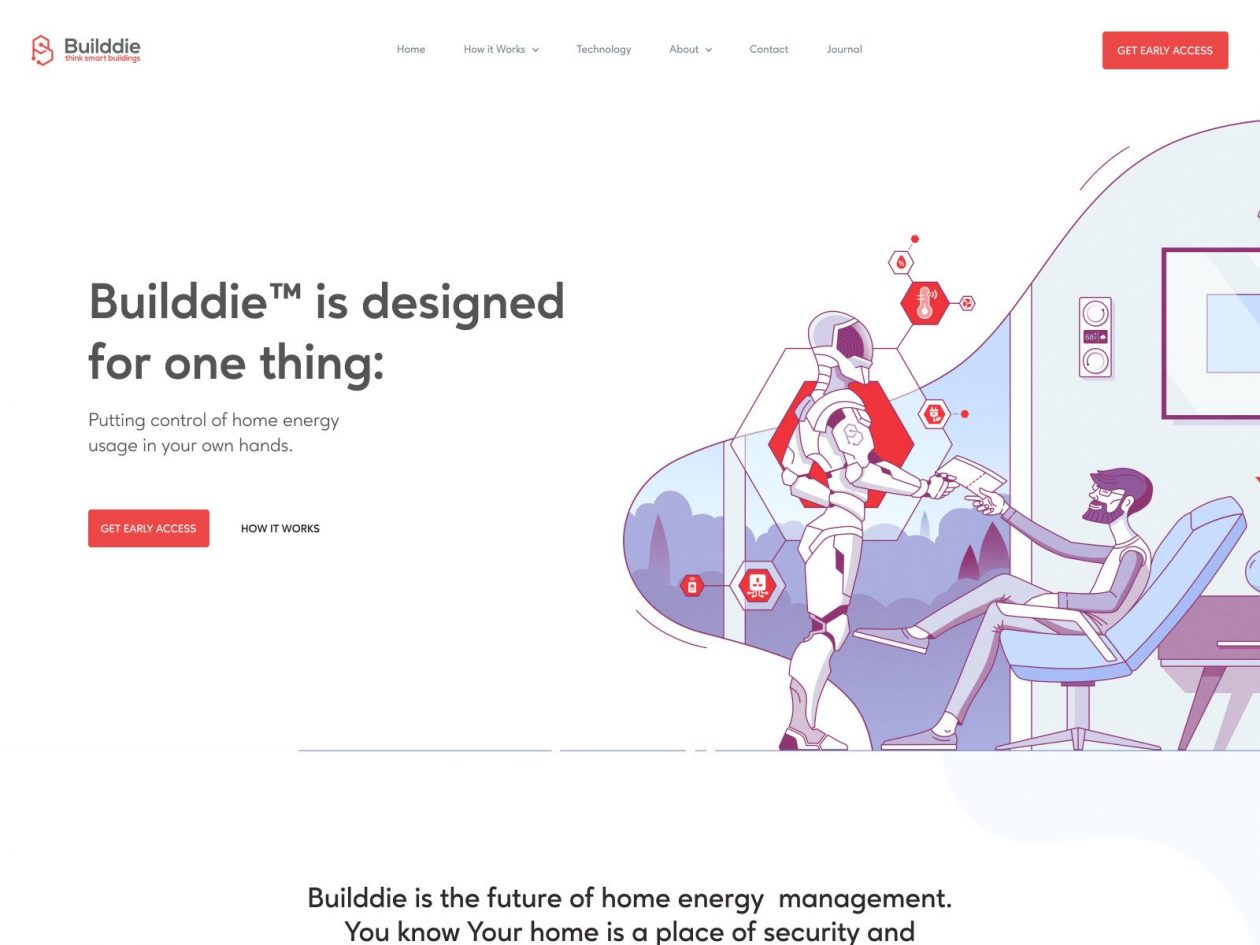
Builddie Website Homepage by Shakuro
The transferable part is narrow: a table a person can actually read, and a front end that does not fall apart when the data is wide. A company that needs learner events, definitions, and a report checked against source rows still has to brief those. Treating these two cases as finished e-learning analytics software would misstate what was published.
Why Work with a Data Analytics Development Company
The useful test of a team is not a stack slide. It is whether they can write the first release as a boundary. Which events, which one role’s screen, which questions, and what is explicitly out. A team that adds a live stream, a model, and a broker “to be safe” is estimating a program, not a report you can launch.
Ask what happens when the same attempt arrives twice. Ask how “complete” is defined. Ask what is not in the first release. Those three answers matter more than a list of industries. Shakuro’s e-learning work is the service linked at the top. A model, if you need one later, is a separate AI development estimate. The design cases above are the evidence we will stand behind, with the limits just stated.
Bring the event list and the exclusion list. Get in touch. The conversation is about whether this layer is the right commission, not about filling a feature sheet.
FAQ
What drives the cost of elearning analytics software?
Scope, not a rate we can print here. How many events, how long they are kept, how many source systems, whether the refresh is nightly or live, whether the first release stops at counts or includes a model, and how many roles may see a score. One learning product with a written definition of “complete” is a smaller brief than three systems, a live exam view, and a forecast. There is no honest universal number.
What should an MVP elearning analytics dashboard include?
One role, one screen, and the short event list in the behavior section: lesson start and complete, video position, quiz attempt and submit, session end. Completion, drop-off by step, and quiz result by item, each with the definition written next to the name. A check that a known cohort matches the source rows. Leave out the live stream, the model, the broker, and every extra role. Those are later estimates. An enterprise rollout is phased. It is not a larger copy of the same first screen pasted into a proposal.
Which integrations and privacy requirements affect learning analytics software development?
The learning product that emits the events, first. The HR record, if the report must filter by department or role. Payments, only if “who paid” is one of the four questions. A second school, only if the tenant boundary is in the brief. For privacy, name what is stored, who can see a score, and how long events are kept. Counsel decides the legal basis. We do not switch a compliance label on. If statements must be exchanged with another system, agree a vocabulary such as Caliper Analytics before the build. If no second system needs the statements, do not add the exchange to the first release.
How do you make sure elearning analytics software reports accurate numbers?
Compare a cohort the team can count by hand with the rows the report used. The same attempt posted twice must stay one attempt. A timestamp must not move a completion into the wrong day. Opening a lesson must not count as finishing it. If those three fail, the chart is not ready. A visual review of the dashboard does not replace that check.
What happens to a learning analytics platform after launch?
Event names will be wrong in places the brief missed, and content will change. Plan a correction pass with a scope, not an open-ended retainer with no list. Add a live view only when someone starts acting the same day. Add a model only as a separate estimate, after the events are stable enough to train on. Do not treat the first month of reports as proof that learning improved. The reports show what happened. The content owner decides what to change.
How do I choose a development partner for learning analytics software?
Ask for the first release in writing, including what will not be built. Ask how a duplicate attempt is handled. Ask what the team does when two editors mean different things by “complete.” A partner who cannot answer those three is not ready to estimate. A portfolio of dashboard pictures is not a substitute for that answer. The cases on this page are design and a smart-home website, stated with those limits. Bring the event list and get in touch.
Final Thoughts
Before you commission this reporting layer, check four things. The questions cross courses, cohorts, or time, and a packaged report cannot ask them. Someone has written what “complete” means. The first screen has one role. You can name what the first release will not include: the live stream, the model, and a second system.
If one of those is missing, fix it before you ask for charts. If all four are true, the next step is a scope conversation, not another article. E-learning web development is the service. Get in touch with the event list, the first questions, and the exclusion list.