Real-time data processing systems collect, process, and deliver data as soon as events happen, so products can react without waiting for batch reports. They are used in fraud detection, trading platforms, IoT monitoring, logistics, live dashboards, and alerts. A typical setup includes event sources, message brokers, stream processors, storage, and APIs or dashboards. The main goal is simple: get fresh data to the right place fast enough for people or systems to act on it.
Contents:
Quick Facts
| Question | Answer |
| Best for | Fraud detection, trading platforms, IoT monitoring, logistics tracking, live dashboards, alerts, and operational analytics. |
| Typical timeline | Around 2-4 months for an MVP, 4-8 months for a middle-size system, and 8+ months for enterprise platforms. |
| Core components | Event producers, message brokers, stream processors, storage, APIs, dashboards, and monitoring. |
| Common tools | Kafka, RabbitMQ, Flink, Spark Streaming, Redis, PostgreSQL, MongoDB, FastAPI, WebSockets, and cloud monitoring tools. |
| Main risk | Poor architecture that causes latency spikes, data loss, duplicate events, or dashboards users stop trusting. |
Introduction
Some software can wait for a neat report in the morning. Some really, really cannot.
Think about a fraud check during payment. Or a trading screen where the price is already old by the time a user sees it. Or a logistics dashboard that says a truck is fine, while the actual truck has been sitting in the wrong place for twenty minutes. Annoying? Yes. Expensive? Also yes.
That is why companies start looking into real-time data processing systems. Not because the phrase sounds nice in a pitch deck, but because delayed data starts hurting the product. Users refresh dashboards. Support teams ask engineers what is going on. Managers open five tabs and still do not know which number is true. I have seen this pattern more than once, and usually the first symptom is not a big outage. It is just a quiet loss of trust.
Real-time infrastructure helps a product react while the data still matters. It can support fraud detection, live dashboards, IoT monitoring, financial analytics, user activity feeds, alerting, and plenty of other workflows where “we will know later” is not good enough.
In this article, we will look at how real-time data processing works, what usually sits inside a streaming architecture, how the development process goes, what affects cost, and where teams tend to get stuck. No magic. Mostly pipes, queues, tradeoffs, and a lot of monitoring.
What Are Real-Time Data Processing Systems?
These systems collect, move, process, and deliver data almost as soon as events happen. A user clicks something. A payment changes status. A sensor sends a value. A broker receives a trade. The system picks up the event and pushes it toward whatever needs it next.
The contrast with batch processing makes it easier to see.
Batch processing is patient. It waits. Data piles up for an hour, a night, a week, then a job runs and creates a report. There is nothing wrong with that. Finance reconciliation, long historical reports, monthly summaries, warehouse exports, all of these can work perfectly well in batches.
Real-time processing is less patient. It deals with data while it is still warm, so to speak. The point is not always “instant” in the cinematic sense. Sometimes a few seconds is fine. Sometimes even a minute is fine. But the system is built around continuous movement, not a scheduled dump.
You will usually meet a few types of systems here:
- Event-driven data systems that react to business events, like signups, payments, user actions, errors, or state changes.
- Streaming analytics systems that keep dashboards, alerts, or live reports updated while data keeps coming in.
- Operational systems where a delay can affect revenue, compliance, safety, or user confidence.
Under the hood, the parts of streaming data processing architecture are fairly recognizable: event producers, a message broker, stream processors, storage, and consumers. The consumer might be a dashboard, API, notification service, machine learning model, admin panel, or some internal tool that nobody outside the team ever sees but everyone depends on.
And if the final output is a dashboard, do not treat the interface like an afterthought. A fast pipeline with a confusing screen still leaves people guessing. Shakuro’s guide on SaaS dashboard development goes deeper into the product side of real-time dashboards, which is its own little world.
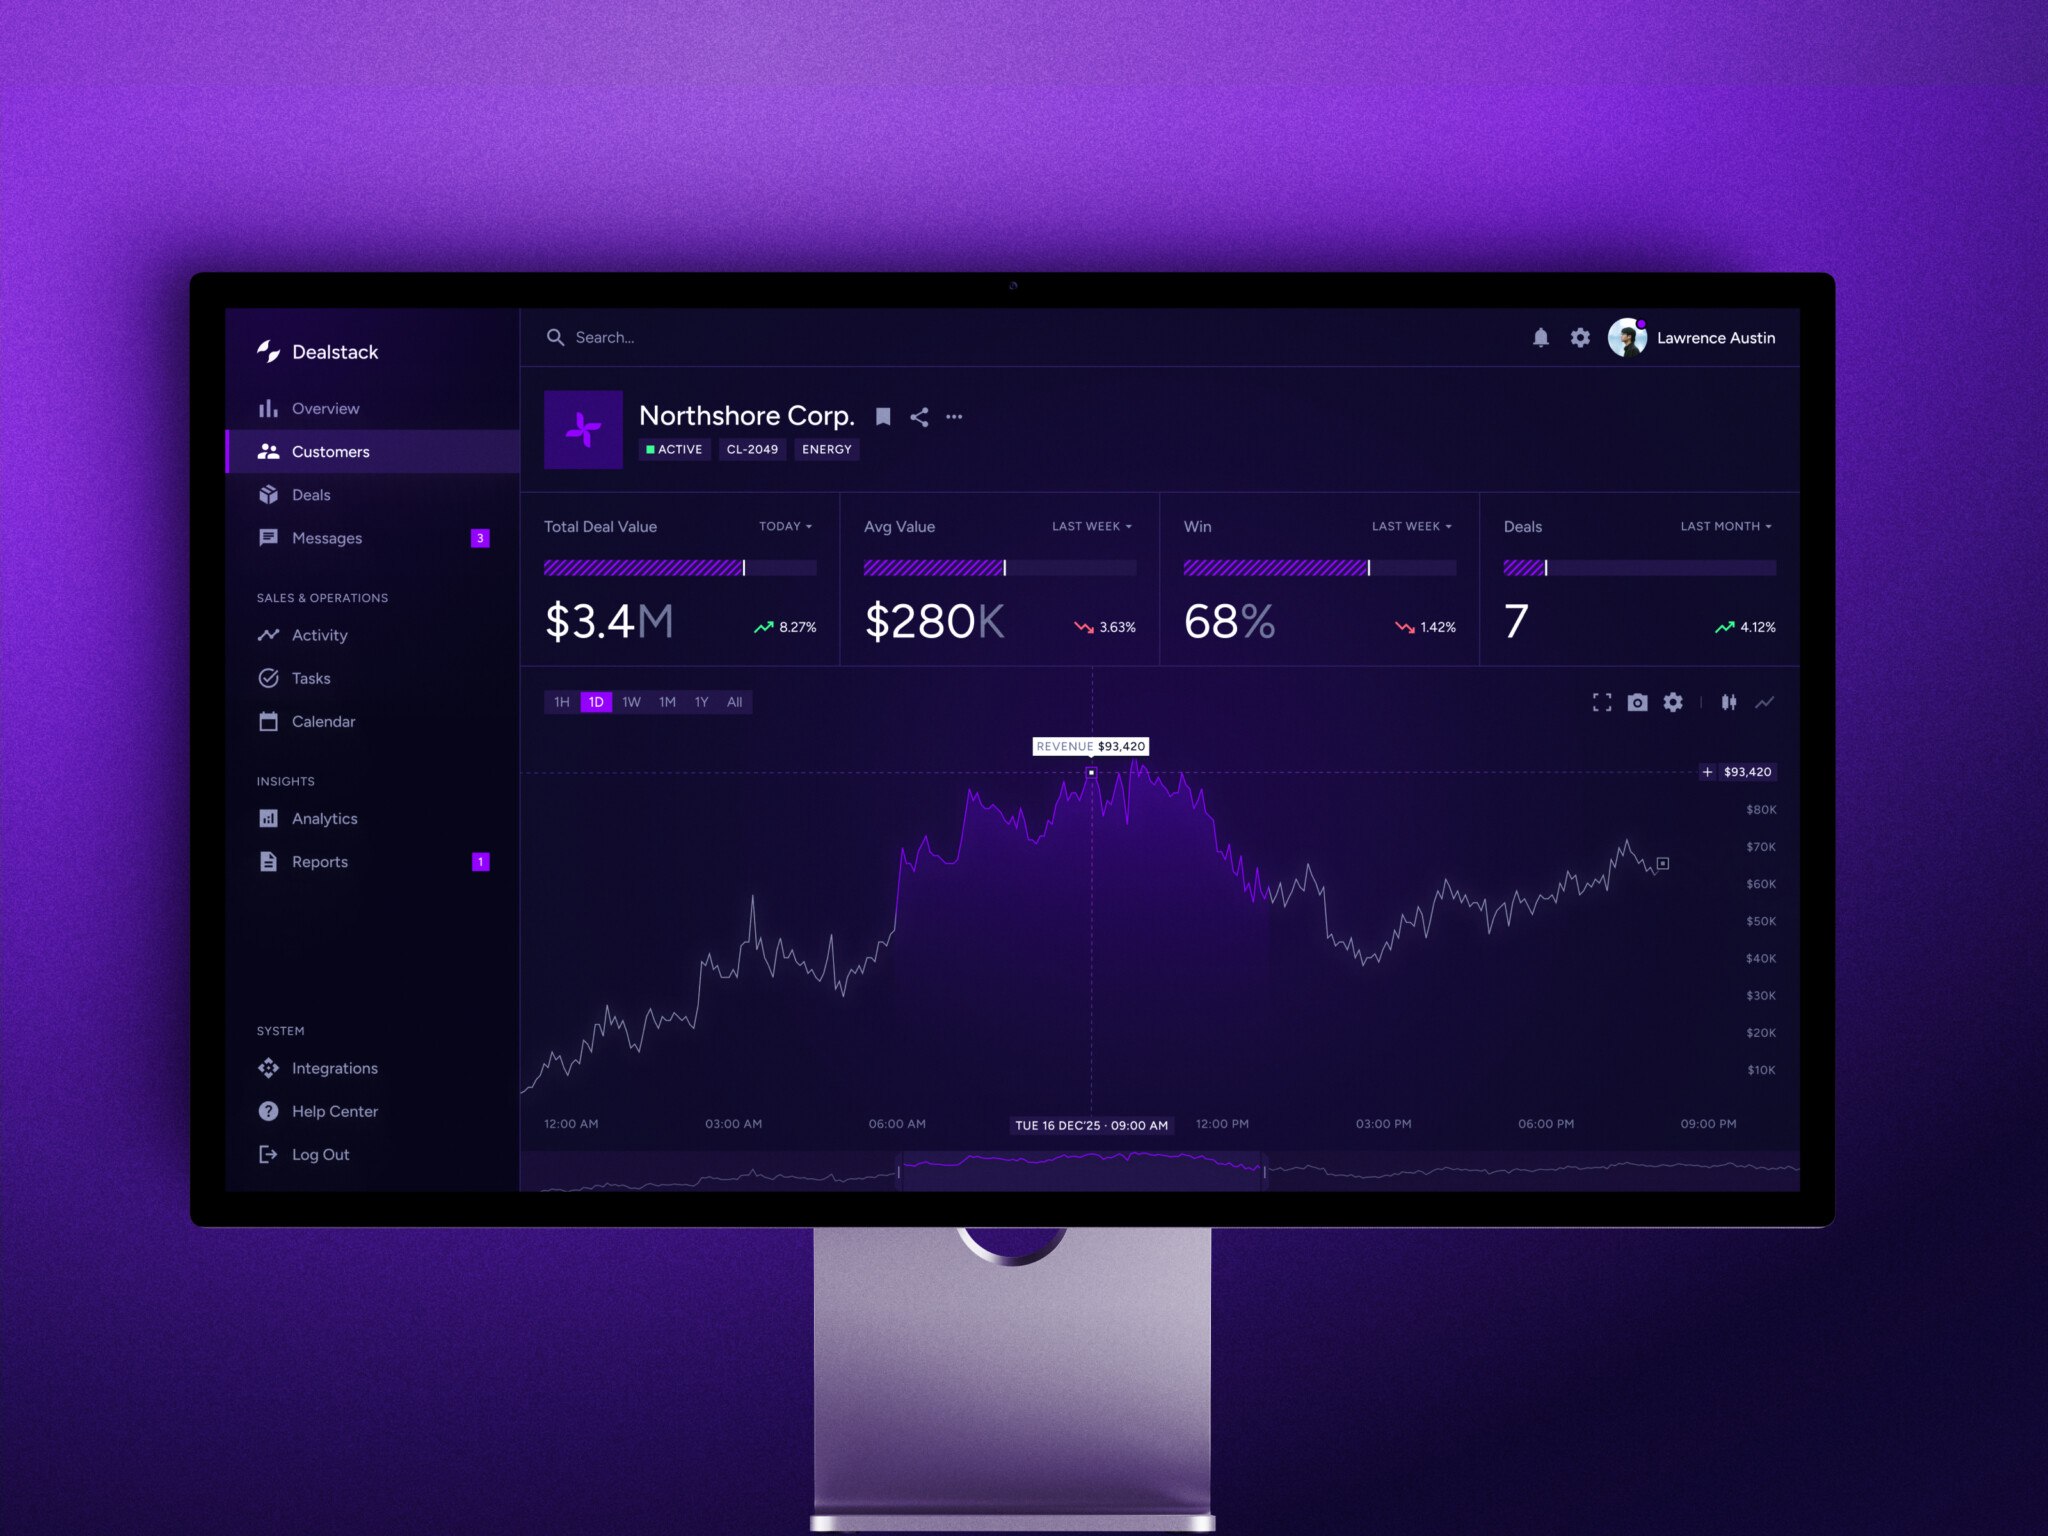
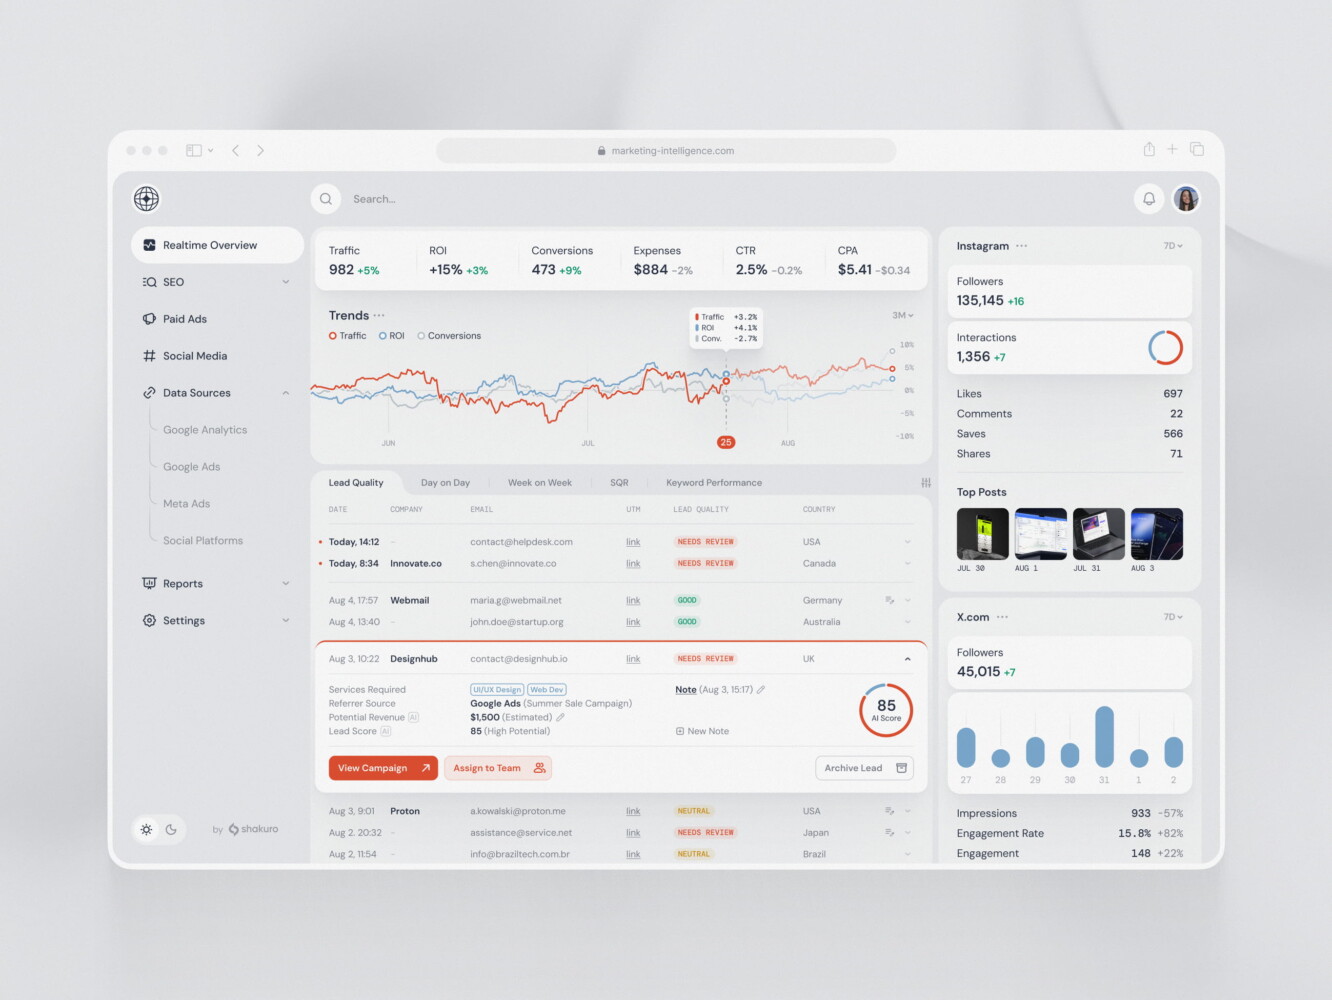
SaaS analytics platform by Shakuro
Key Features of Real-Time Data Processing Systems
Low Latency Processing
Latency is the delay between “something happened” and “the system responded.” Simple definition. Harder to control.
A lot of teams start by saying they need everything in milliseconds. Well, maybe. A trading system and a weekly sales trend do not live in the same universe. A fraud alert may need to happen before a transaction is approved. A SaaS usage chart might be perfectly useful with a 30-second delay. You agree, that sounds reasonable, doesn’t it?
Low latency data processing is about removing waste from the path. Fast ingestion. Small transformations. Queues that do not clog. Databases that are not asked to do silly things. APIs that return what the interface needs instead of dumping half the warehouse into a JSON response.
The best latency target is the one tied to the product decision. Anything else can become a costly engineering hobby.
Event-Driven Architecture
In a request-response setup, one service asks another service for something and waits. That is fine for many parts of a product.
But with real-time work, one event often needs to wake up several parts of the system. A payment succeeds. Billing updates. The dashboard changes. A notification goes out. A risk score gets recalculated. Maybe a CRM record is touched too, because, of course, it is.
Event-driven architecture lets a service publish an event and move on. Other services subscribe and react. This reduces tight coupling, and more importantly, it lets the product grow without turning every workflow into a chain of direct calls.
It is not automatically simpler, by the way. You get new problems: event schemas, retries, ordering, duplicates, visibility. But for many real-time products, it is still the best option because the system can breathe a little.
High Throughput
Throughput is the boring word for a very real question: how much traffic can this thing handle before it starts wheezing?
A prototype that handles 100 events per minute might look great. Then production arrives with user spikes, mobile clients reconnecting, third-party APIs sending bursts, and some old integration doing weird things every night at 2 a.m. Suddenly the smooth demo is not so smooth.
High throughput depends on broker setup, partitions, worker scaling, storage writes, backpressure, and how heavy each processing step is. Sometimes the fix is more infrastructure. Sometimes it is just removing one bad query. Honestly, the second one feels better.
Fault Tolerance
Things fail. Brokers restart. A processor crashes. A network route gets strange for ten minutes. A downstream API times out right when traffic peaks. It is a little annoying, but you get used to designing around it.
Fault tolerance means the real-time analytics systems can recover without losing their minds. Retries help. Dead-letter queues help. Checkpoints help. So do replayable logs, idempotent handlers, backups, and clear alerts.
The unpleasant truth is that a real-time data pipeline can look fast in a demo and still be fragile. You only discover it later, when one consumer slows down and the queue starts growing like bread dough.
Real-Time Data Delivery
Processing the data is not the end. Someone or something has to receive it.
That could be an operations dashboard, a customer analytics page, a webhook, an alerting system, or a mobile app. The delivery method depends on how fresh the data needs to feel. WebSockets can work well for live interfaces. Server-Sent Events are sometimes enough and easier to manage. Polling is not glamorous, but in some cases it does the job. No shame in boring tools when they fit.
The trick is to match delivery to the user’s actual need. If a metric changes once every five minutes, pushing updates ten times per second is just theater.
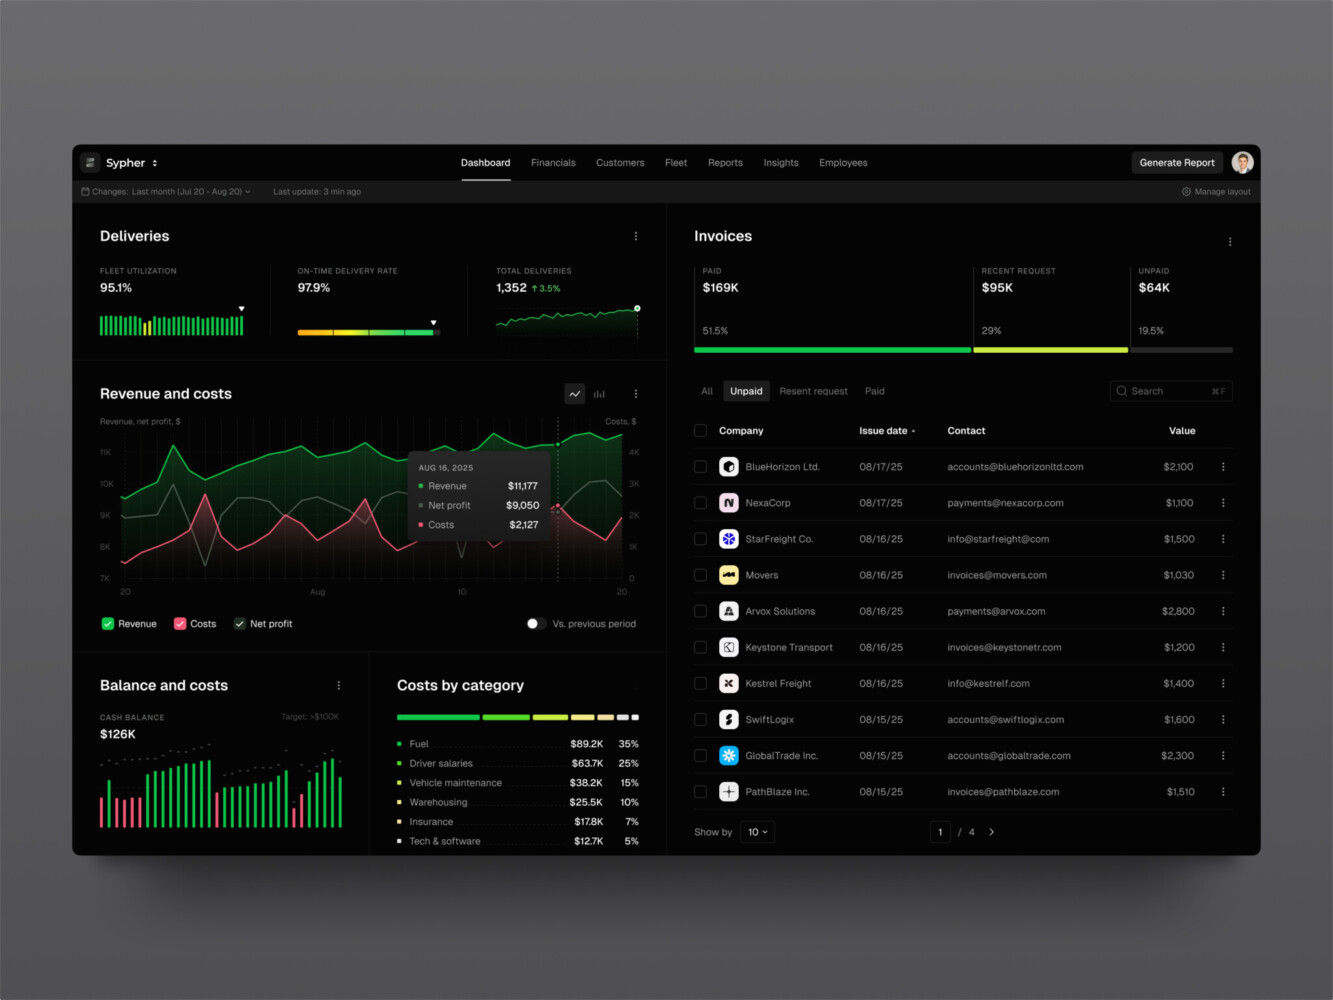
Real-time data dashboard by Shakuro
Real-Time Data Processing Architecture
Streaming Pipeline Overview
Most systems follow a pattern like this:
Event -> broker -> processor -> storage -> consumer
An event comes from a product, device, service, or external source. The broker receives it and keeps the stream organized. A processor validates, filters, enriches, or aggregates the data. Storage keeps what needs to be saved. Consumers use the result.
That is the basic streaming data processing architecture. Sounds tidy on paper. In the real world, the hard part is knowing where a problem lives. Is ingestion slow? Is the broker lagging? Is the processor stuck on one ugly payload? Is the dashboard making too many requests? You need visibility at every step, or debugging turns into guesswork with coffee.
Message Brokers
Message brokers move events between producers and consumers. Kafka and RabbitMQ are two names that come up often, though they are not interchangeable.
Kafka is common when teams need high-throughput event streams, replayable logs, and several consumers reading the same event history. RabbitMQ is often used for routing messages, job queues, and workflows where delivery patterns matter more than storing a long event log.
The broker shapes the personality of the whole system. That sounds a bit dramatic, but it is true. It affects scaling, recovery, event replay, consumer independence, and how painful future integrations will be.
Stream Processing Engines
Stream processors do the work while data is moving. They clean events, join streams, calculate rolling metrics, enrich records, detect anomalies, or prepare data for storage.
Apache Flink and Spark Streaming are used when the processing gets serious: windows, joins, replay, state, high volume, and so on. For a smaller product, a few services written in Python or Node.js may be enough. In my experience, this is where teams can overbuild. Someone mentions Kafka, then Flink, then Kubernetes, and suddenly a simple MVP has the emotional weight of a bank core system.
Use a dedicated stream processing platform when the workload deserves it. If the job is light, keep the setup lighter too.
Storage Layer
Storage is not one decision. It is usually several.
Raw events might go into object storage so the team can replay or audit them later. Aggregated metrics may live in PostgreSQL, ClickHouse, a time-series database, or another store designed for fast reads. Short-lived state may sit in Redis. Flexible records may fit a NoSQL database better.
The right choice depends on how the data is used. A compliance audit needs a different shape from a live chart. A customer-facing dashboard needs fast, filtered queries. An internal anomaly detector may care more about event history and replay.
One small practical note: storage choices are also people choices. If nobody on the team knows how to operate a certain database, that database is not free, even if the license says it is.
API and Delivery Layer
The API layer is where processed data becomes part of the product.
For a live dashboard, the backend has to stay quick without hammering the database. For an operational tool, permissions and audit logs may matter as much as speed. For SaaS analytics, tenant isolation is non-negotiable. One customer seeing another customer’s data is not a bug you want to explain.
FastAPI can be a good fit for Python-based APIs, especially when the product needs async behavior and clean documentation. For example, Shakuro’s web development services cover the wider layer too: backend architecture, API design, frontend integration, and the parts around the screen that users actually touch.
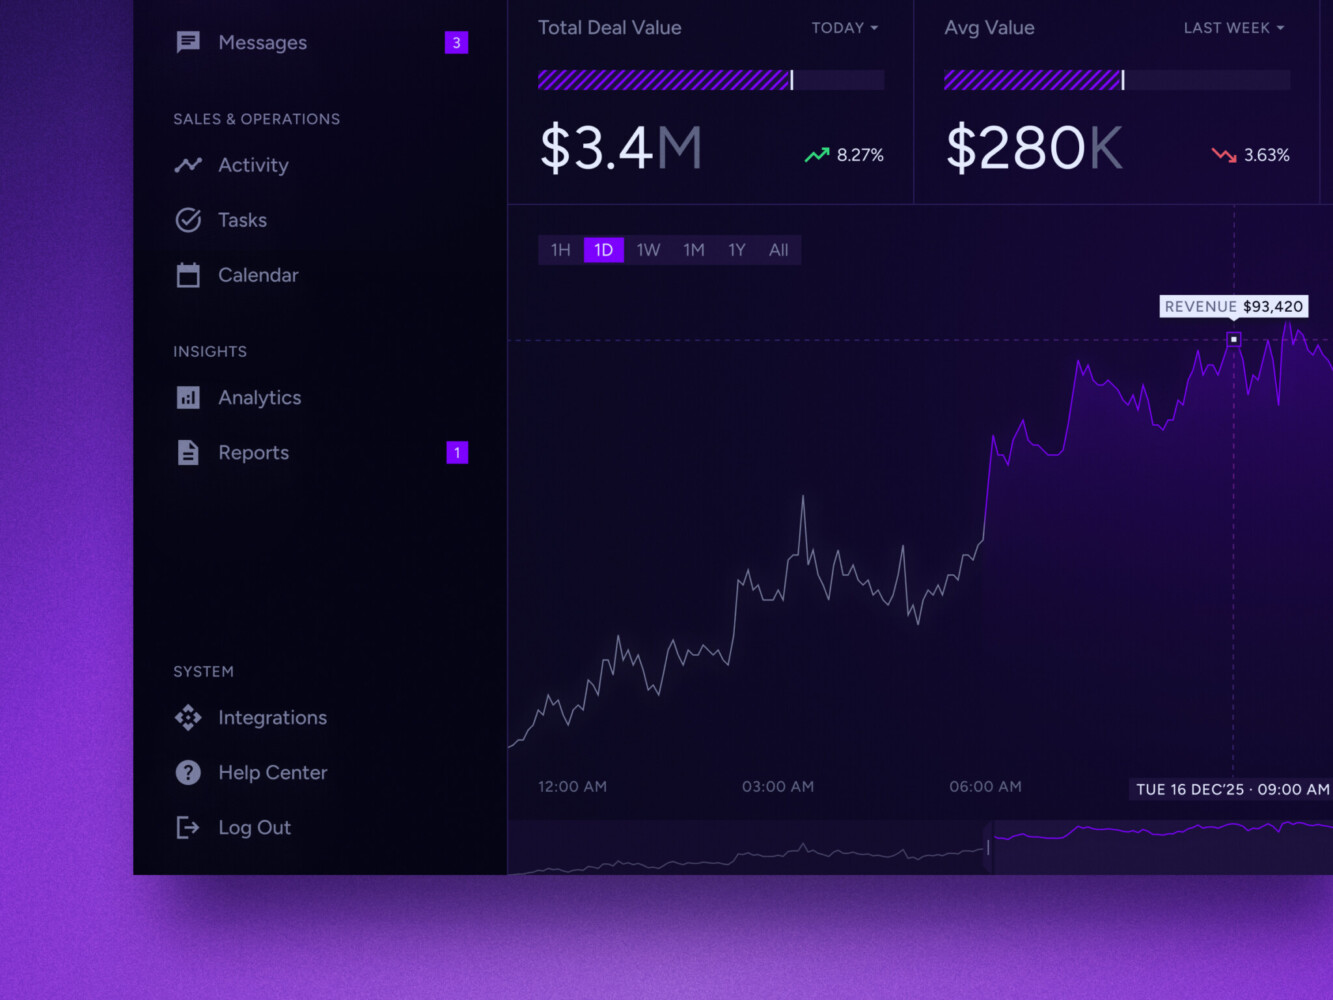
SaaS marketing dashboard by Conceptzilla
Real-Time Data Processing Development Process
1. Define the Use Case
Start with the business question. Not the broker. Not the cloud provider. The question.
What happened? Who needs to know? How fast? What happens if the answer is late? What happens if the answer is wrong?
These questions sound basic, but they save money. A real-time analytics system for executives may tolerate a short delay. A payment risk engine may not. A patient monitoring tool may need a different level of reliability again.
Before picking tools, define latency, data volume, event sources, retention, security needs, and the decision the system supports. Otherwise, the team can spend weeks optimizing something nobody needed in the first place.
2. Design the Architecture
Once the use case is clear, the architecture can start taking shape.
Some products need a mostly event-driven model. Some use a hybrid approach: batch jobs for historical data, streaming for fresh events. That is common, and honestly, often healthier than pretending everything must be live.
This is also where you define event schemas, ownership, broker topics or queues, processing rules, storage responsibilities, and delivery methods. It is not the most exciting part of the project. Still, future-you will be grateful.
3. Choose the Technology Stack
The stack should fit the workload and the team.
Python is useful for data work, automation, backend services, and integrations. Node.js can be handy for WebSockets and event-heavy application logic. Kafka, RabbitMQ, Flink, Spark Streaming, Redis, PostgreSQL, MongoDB, and time-series databases all have their place.
For API-heavy products, FastAPI is a practical choice because it works well with async Python and produces clear API docs. For broader backend and pipeline work, Python development can cover ingestion, processing logic, integrations, and service code.
My rule of thumb: if the team cannot explain why a tool is there, the tool probably needs another look.
4. Build the Pipeline
Real-time data pipeline development means setting up event ingestion, broker configuration, processing services, schema validation, storage, and delivery.
This is where the process gets very concrete. Which fields are required? What happens to invalid events? Can the processor handle duplicates? How do we know if a consumer is falling behind? Where do failed messages go?
A good pipeline is observable from the start. You want event volume, processing time, broker lag, retry counts, queue depth, downstream errors, and delivery success visible somewhere. Otherwise a production issue becomes a long guessing session, and nobody enjoys those.
5. Integrate with Product Systems
Real-time infrastructure rarely sits alone in a corner. It feeds dashboards, APIs, alerting tools, analytics products, admin panels, mobile apps, and sometimes old systems that everyone is slightly afraid to touch.
This is where product thinking matters. A technically correct pipeline is not enough if the dashboard is noisy or the alert says “something is wrong” without saying what. People need enough context to act.
For data-heavy screens, UX is part of the system. Filters, empty states, loading states, drill-downs, permissions, and chart labels all matter.
6. Test and Simulate Load
Do not only test the happy path. That is where disappointment sneaks in later.
Push traffic spikes through the system. Send duplicate events. Delay events. Break a consumer. Make the broker slow. Feed the dashboard quick updates and see whether it stays readable. Check if alerts fire once or spam everyone like a nervous intern.
Load simulation is not just for large enterprises. Even an MVP can fail badly if one launch campaign sends more traffic than expected. It happens.
7. Deploy and Monitor
Deployment is the beginning of the system’s real life.
Track latency, throughput, broker health, processor lag, storage performance, API response time, and delivery success. Add logs and traces that help engineers understand not only that something failed, but where it failed.
For ongoing operations, Shakuro’s support and maintenance services include cloud infrastructure, CI/CD, monitoring, load testing, reliability work, and the less glamorous maintenance tasks that keep a product calm in production.
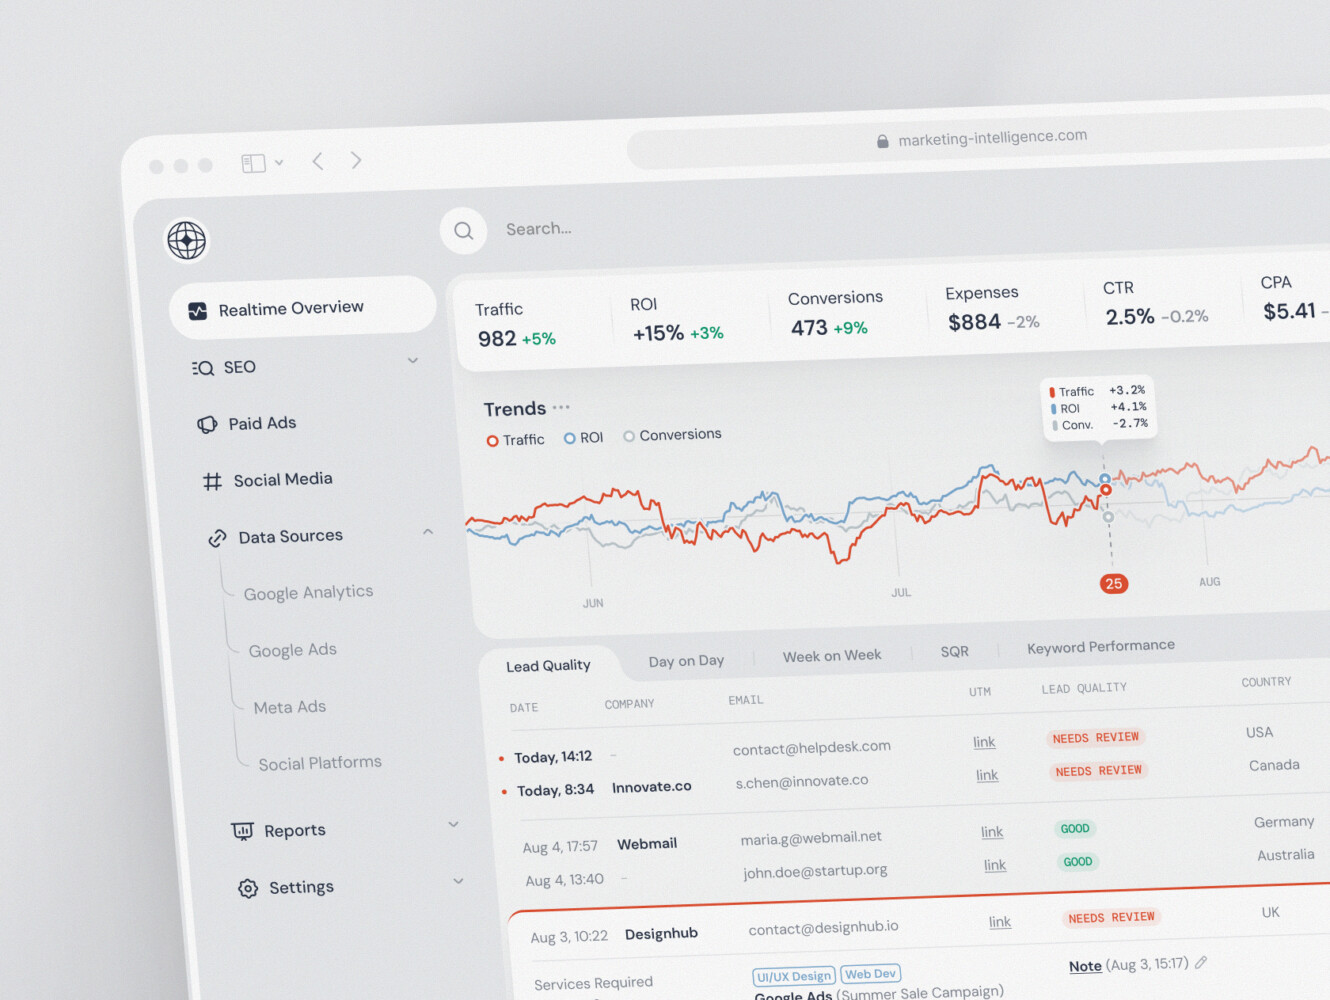
SaaS marketing dashboard by Conceptzilla
Cost of Real-Time Data Processing Systems
Costs vary a lot, because “real time” can mean a small live dashboard or a large platform with strict uptime, audit logs, and multiple streams.
| Scenario | Approximate cost | Typical scope | Best fit |
| MVP real-time system | $25,000-$60,000 | One or two data sources, basic event ingestion, simple broker setup, lightweight processing, storage, and a small dashboard or API. | Startups or product teams testing whether live data really improves the workflow. |
| Middle-size real-time system | $60,000-$180,000 | Several event sources, more complex processing, API layer, dashboard integration, monitoring, retries, role-based access, and better scaling. | Growing SaaS, fintech, logistics, healthcare, or e-commerce products with real users and clearer load patterns. |
| Enterprise real-time platform | $180,000-$500,000+ | Multiple streams, high availability, audit logs, replay, advanced security, compliance work, multi-region or cloud-heavy infrastructure, load testing, and long-term support. | Large platforms where delays, data loss, or downtime can create serious business or regulatory risk. |
The main cost drivers are:
- Data velocity: how many events arrive per second, minute, or day.
- Processing complexity: validation, enrichment, routing, aggregation, machine learning, or custom business logic.
- Infrastructure: brokers, processors, databases, cloud services, scaling, backups, and redundancy.
- Integrations: dashboards, external APIs, legacy systems, notification tools, and analytics platforms.
- Reliability and security: monitoring, disaster recovery, access control, compliance, and incident response.
An MVP streaming system can be fairly focused: one or two event sources, a broker, a simple processor, storage, and a dashboard or API. That is often enough to prove value.
An enterprise platform is a different animal. Multiple streams. Replay. Audit trails. Role-based access. Multi-region infrastructure. Load testing. Stronger monitoring. More people involved. More meetings too, unfortunately.
The best option in real-time data engineering is usually to build what the business needs now, while leaving room to grow. Do not build a cathedral when the product still needs a working front door.
Common Challenges in Real-Time Data Processing
Latency Spikes
Averages can lie. The dashboard may show a nice average response time while users still hit ugly delays.
That is why percentiles matter. A system with a 100 ms average and occasional 10-second waits can still feel broken. Spikes often come from traffic bursts, slow consumers, broker lag, cold starts, bad queries, or downstream services having a bad afternoon.
Data Consistency
Real-time data does not always arrive politely.
Events can be late. Or duplicated. Or out of order. Or missing one field because some old client app was never updated. If the system does not expect that, numbers start looking strange. Then people stop trusting the dashboard, and once that happens, winning them back is hard.
Define the rules early. Which timestamp matters? How are duplicates handled? Can an event be corrected later? What is the source of truth?
System Failures
Every distributed system fails somewhere eventually. The goal is not to prevent every failure. That is fantasy. The goal is to recover without losing data, confusing users, or waking up half the team for something a retry could handle.
Retries, dead-letter queues, replayable logs, backups, graceful degradation, and incident alerts all help. So does keeping the architecture understandable. A clever system that only one person can debug is a risk wearing a nice jacket.
Complex Architecture Management
Stream processing platforms collect moving parts. Brokers, schemas, processors, storage, APIs, dashboards, permissions, monitoring, deployments. It adds up.
The boring habits help: event catalogs, data contracts, diagrams, runbooks, ownership notes, and clear naming. Nobody gets excited about naming conventions during planning. Then six months later someone finds a topic called events-new-final-v2, and the whole team pays for that decision.
If the product also depends on large-scale analytics, connect the live layer with the wider data strategy. Real-time streams, dashboards, warehouses, and long-term reporting should not fight each other.

Telematics Company SaaS Dashboard by Shakuro
Our Experience in Real-Time and Data Systems
Shakuro works with high-load backends, complex product architecture, and analytics-heavy interfaces where speed and clarity both matter. That combination is important. A fast backend with a messy interface still leaves users unsure. A beautiful dashboard on top of slow data is just decoration.
In Symbolik Social, the product context is financial analysis and social trading. Systems like that depend on structured data, clear interaction, and quick access to market-related insights. Together with the DeMark team, we built the system that offers real-time analytics in glanceable, easy-to-use dashboards. Professionals can share insights and make timely decisions.
In TraderTale, Shakuro designed a gamified fintech platform around trading profiles, reputation, and user behavior. The interesting part is not only the visual layer. Products like this need data flows that support timely updates, meaningful metrics, and user trust.
The same thinking applies to real-time infrastructure. Backend performance, event flow, API design, dashboard UX, and maintenance all need to work together. One weak layer is enough for users to feel friction.

Why Work with a Real-Time Systems Development Company
Real-time data engineering looks deceptively simple from the outside. Data comes in, something processes it, a dashboard updates. Nice.
Then the real questions arrive. How do we handle duplicates? What if messages arrive out of order? Which database should serve dashboard queries? How do we test traffic spikes? Who owns the event schema? How do we keep tenant data separate? What happens when the broker is fine but one consumer is painfully slow?
An experienced development partner can help with:
- Designing event-driven architecture around the actual product workflow.
- Choosing a broker, processor, storage layer, and API approach that fit the case.
- Building low-latency systems without turning the MVP into a science project.
- Testing the platform under realistic load.
- Connecting backend pipelines with dashboards, alerts, and product interfaces.
- Planning monitoring, support, and future scaling before production gets noisy.
This is useful for fintech, SaaS, healthcare, e-commerce, logistics, IoT, and other products where delayed or incorrect data creates real business risk.
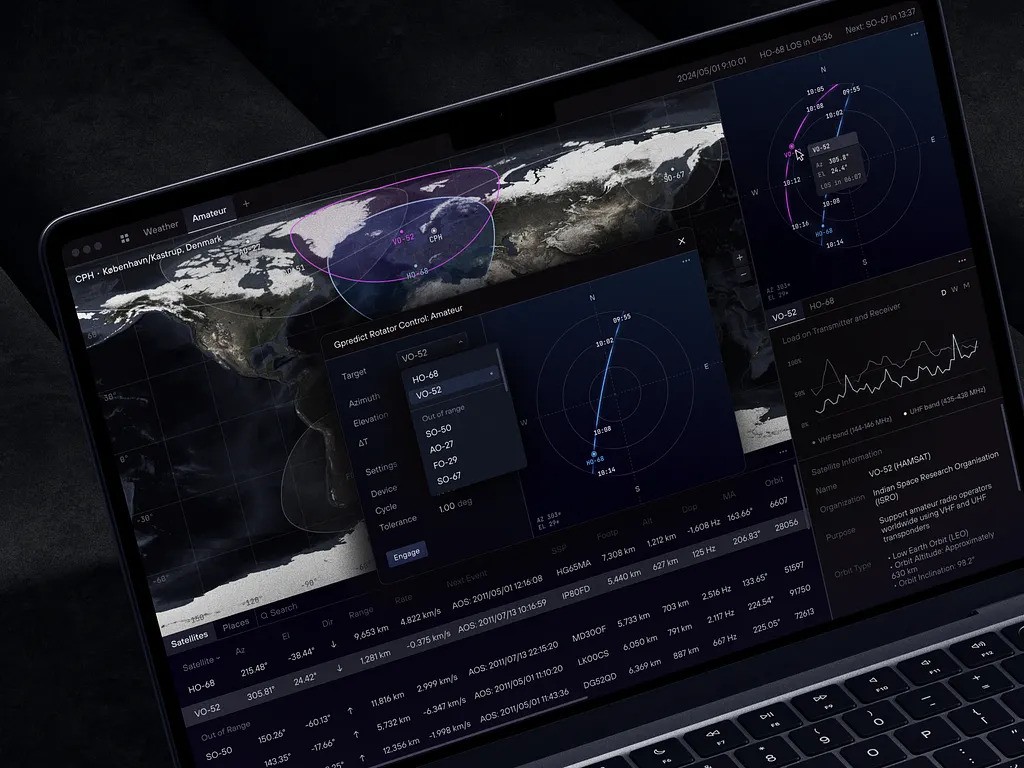
Dashboard for Satellite Monitoring and Management by Shakuro
Final Thoughts
Real-time data processing systems are basically about turning events into action while the action still matters.
A user does something. A device reports something. A transaction changes state. A service emits a signal. The system catches it, processes it, and sends the result where it needs to go.
Sounds good, right? It is, when the architecture is clear. The hard part is keeping the system reliable, understandable, and affordable as the product grows.
Start with the use case. Define the latency that actually matters. Pick tools the team can operate. Build observability early. Test the ugly cases. And do not forget the people looking at the final dashboard, because they are the ones who decide whether the system feels useful.
If you are planning a real-time data product, Shakuro can help design and build the backend, streaming pipeline, APIs, dashboards, and support process behind it.
FAQ
What is this kind of live data system?
It is a system that collects, processes, and delivers data soon after events happen. You see it in fraud checks, trading tools, IoT monitoring, logistics tracking, live dashboards, and operational alerts.
How is real-time processing different from batch processing?
Batch processing handles data in scheduled chunks. Real-time processing keeps working as events come in, so the product can react much sooner.
Which technologies are used for live event streams?
Common tools include Kafka, RabbitMQ, Flink, Spark Streaming, Redis, PostgreSQL, MongoDB, time-series databases, Python, Node.js, FastAPI, WebSockets, and Server-Sent Events. The right stack depends on traffic, latency, processing logic, and the team’s experience.
How much does it cost to build a real-time data pipeline?
It depends on event volume, architecture, integrations, infrastructure, reliability, security, and monitoring. A focused MVP costs much less than a large platform with replay, audit logs, high availability, and strict compliance.
Do all analytics products need real-time data?
No. Some dashboards are fine with hourly or daily updates. Real-time architecture is worth it when fresher data changes decisions, reduces risk, improves the user experience, or supports work that cannot wait.
Why is fault tolerance important in real-time systems?
Because event streams keep moving when something breaks. Fault tolerance helps the system recover from broker issues, processor crashes, network problems, duplicate events, and slow consumers without losing data or confusing users.