
SaaS companies collect a lot of data before they know what to do with it.
Contents:
Product events sit in one tool. Billing data lives somewhere else. CRM notes hide inside sales pipelines. Support tickets pile up in another system. Marketing attribution, if it behaves that week, tells a slightly different story again. At first, this is manageable. Someone exports a CSV, someone else updates a spreadsheet, and the Monday meeting survives.
Then the company grows.
MRR in the finance sheet does not match the dashboard. Churn appears too late. Product teams see feature usage but cannot connect it to revenue. Customer success managers sense an account is cooling off, but they do not have a clear signal. Founders walk into investor calls with numbers they had to double-check at midnight. It is a little annoying at first. Later, it gets expensive.
That is where SaaS analytics platform development starts to matter. A good platform is not just another KPI screen. It connects subscription, product, customer, and revenue data into one decision system. Less guessing. Fewer “why is this number different?” conversations. More time spent fixing the actual business.
In this article, we will lay out what this kind of product is, what features it needs, how the architecture usually works, what it costs, where teams get stuck, and how real data-heavy products approach analytics from the product side.
SaaS analytics platform development is the process of building a custom reporting and data intelligence system for subscription businesses. It connects billing, product, CRM, support, and marketing data into dashboards, reports, forecasts, alerts, and customer health insights.
What is a SaaS Analytics Platform?
This platform is software that collects, cleans, connects, analyzes, and visualizes data from a subscription business.
That sounds neat, maybe too neat. In practice, it means the platform pulls information from billing systems, product event tracking, CRM, support tools, marketing sources, databases, and data warehouses. Then it turns that material into metrics, dashboards, reports, alerts, forecasts, and account-level insights people can actually use.
Generic BI tools can show business data. Subscription analytics goes deeper into the logic behind recurring revenue, plan changes, churn, retention, expansion, product adoption, trial conversion, customer health, and customer value tracking. That focus changes the whole product.
For example, a normal BI report might show total revenue by month. Useful, sure. A subscription metrics dashboard needs to separate new MRR, expansion MRR, contraction, churned MRR, upgrades, downgrades, reactivations, discounts, failed payments, and sometimes revenue recognition rules. Same word, “revenue,” but the work underneath is very different.
This is why many teams start with ready-made tools, then later move toward a custom analytics SaaS platform. The moment metric definitions become part of the product’s operating system, a generic setup begins to feel tight around the shoulders.
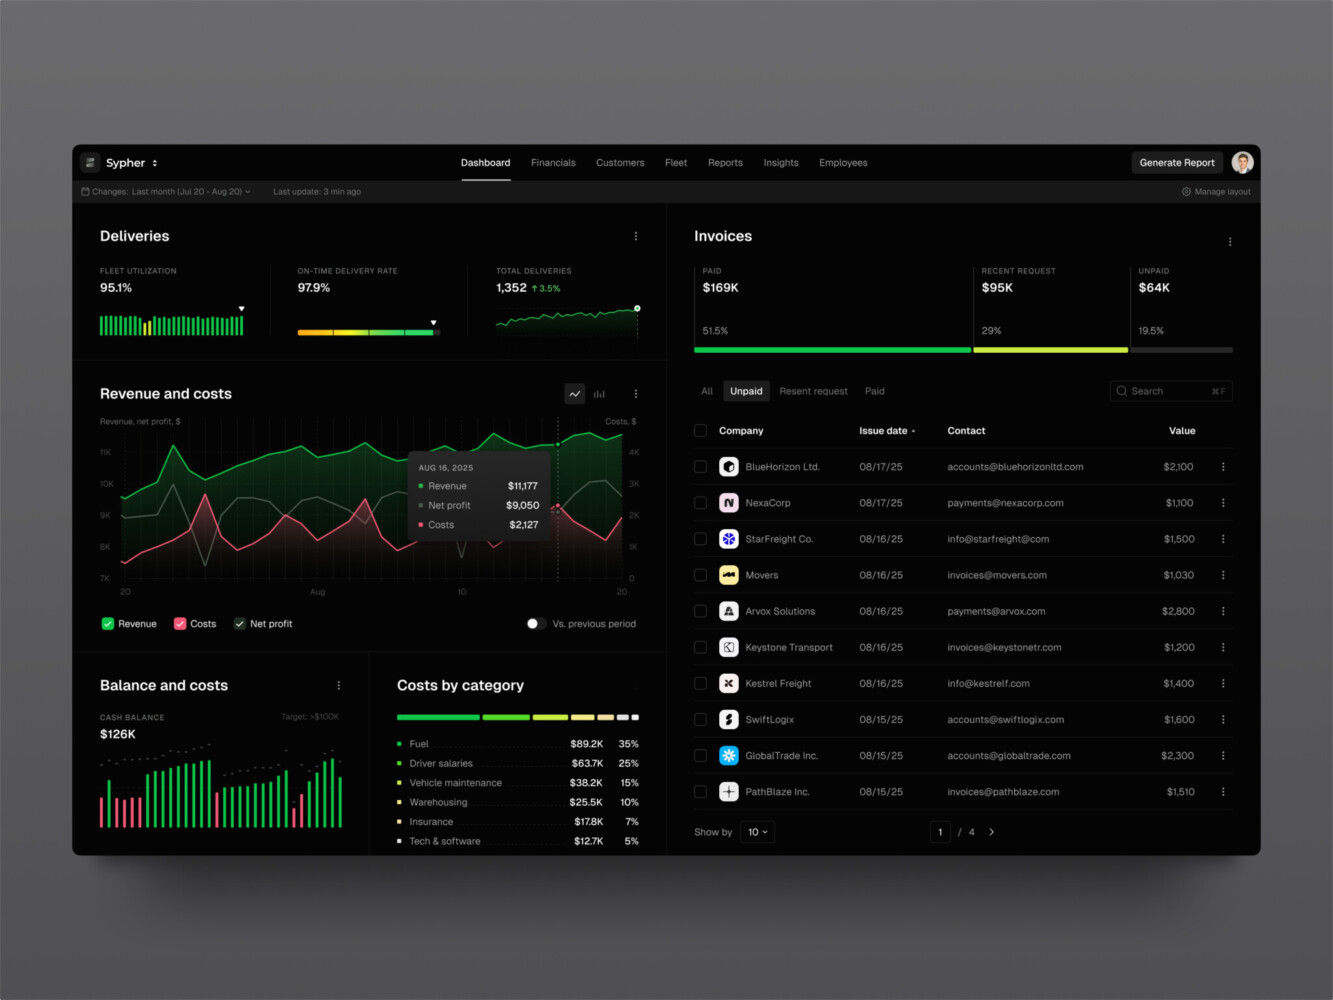
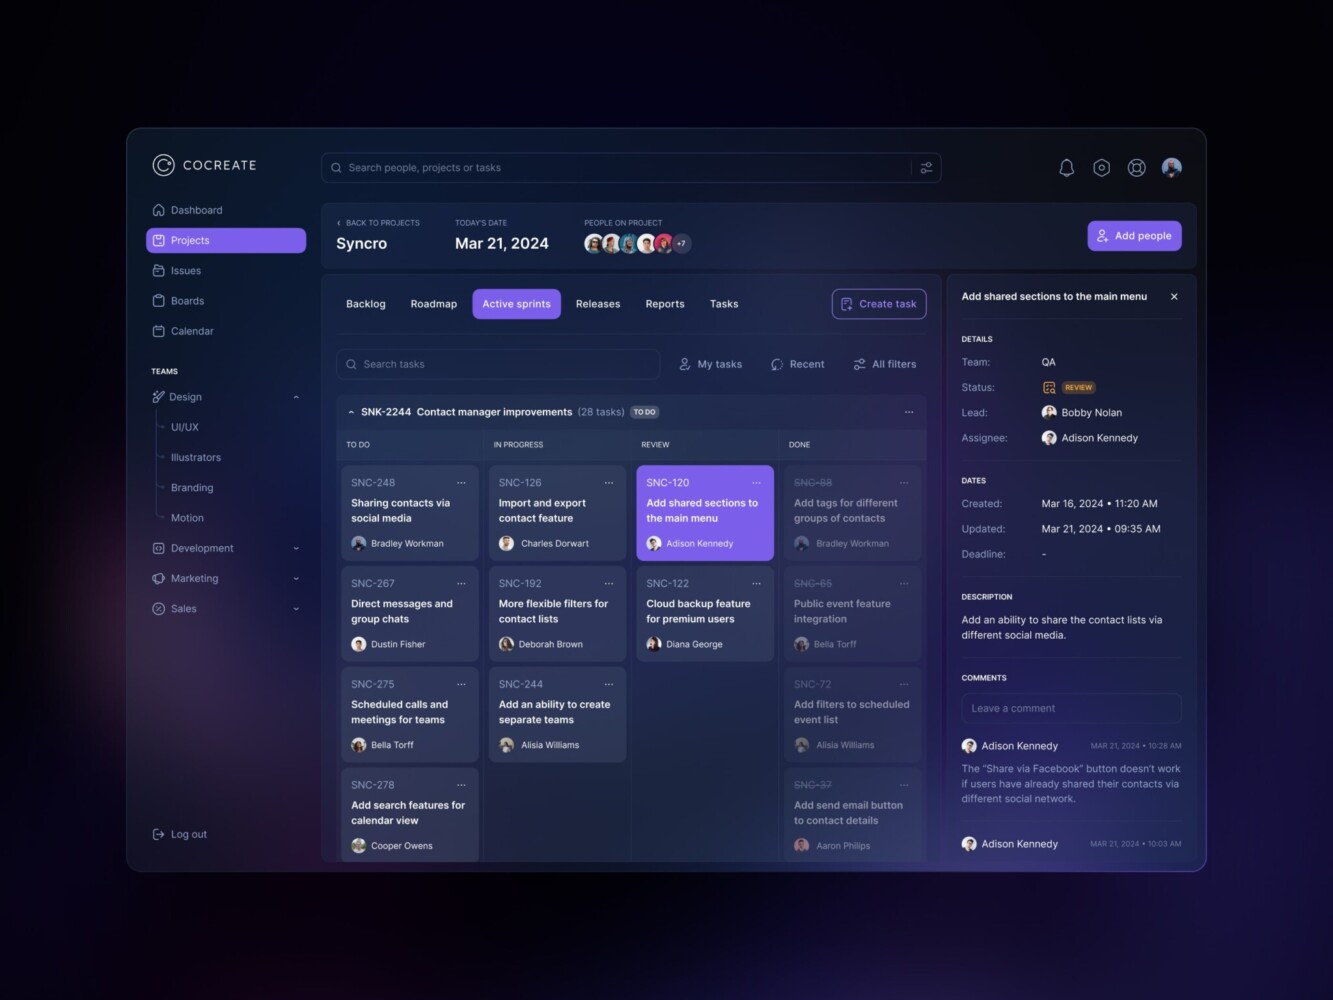
SaaS analytics platform by Shakuro
Why SaaS Companies Need Custom Analytics Platforms
The short answer: SaaS companies need them when the business has outgrown scattered reporting. The longer answer is messier, because the pain rarely arrives all at once. It creeps in.
One team tracks active users by login. Another tracks active accounts by meaningful product action. Finance looks at paid subscriptions only. Customer success adds “healthy” accounts based on renewal conversations. Sales cares about expansion potential. Product wants to know which features lead to retention. Everybody is reasonable, and still the numbers fight each other.
In my experience, the worst dashboard problem is not a bad chart. It is a chart people no longer trust. Once that happens, teams go back to private spreadsheets. You can almost hear the analytics system deflating.
A custom analytics SaaS platform helps when:
- Revenue metrics need context from product behavior.
- Churn prediction depends on usage signals, not only billing status.
- Founders and executives need board-ready reporting.
- Product, finance, sales, and customer success need different dashboard views.
- Enterprise customers need tenant-level reports and permissions.
- Embedded analytics becomes part of the paid product.
And one more point: good analytics reduces emotional fog. Sounds soft, but it is true. When teams argue from the same metric layer, conversations become calmer. You still have hard decisions, but at least you are looking at the same weather.
Types of Analytics Platforms for SaaS
Not every platform has the same center of gravity. Some are built for product teams. Some live close to finance. Some support customer success. The best option depends on the decisions the company needs to make every week.
Product Analytics Platforms
Product analytics platforms track how users move through the product. They measure activation, engagement, feature adoption, funnels, cohorts, retention, and behavior patterns.
This is where teams ask questions like:
- Where do trial users get stuck?
- Which features bring people back?
- Do power users follow a different path?
- What does healthy usage look like before renewal?
You can run a SaaS business without these answers for a while. But once growth slows, product analytics gets personal. Nobody wants to spend three months shipping a feature that users open once and never touch again.
Revenue Analytics Platforms
Revenue analytics focuses on subscription and billing metrics: MRR, ARR, churn, expansion revenue, contraction revenue, net revenue retention, gross revenue retention, customer lifetime value, CAC payback, and plan movement.
This part needs discipline. If upgrades are counted one way in Stripe, another way in a spreadsheet, and a third way in an investor deck, the company has a reporting problem, not a math problem.
KPI dashboards help finance and leadership see growth in layers. New revenue is good. Expansion revenue is usually better. Churn can hide behind new sales for a while, but not forever. A decent growth view makes that visible early enough to act.
Customer Success Analytics Platforms
Customer success analytics turns product, support, billing, and account data into health signals.
A customer may be paying on time and still be at risk. Maybe usage dropped after onboarding. Maybe support tickets increased. Maybe key users stopped logging in. Maybe the account keeps hitting limits, but no one has offered an upgrade. The platform should notice that.
Common features include health scores, usage alerts, renewal risk detection, expansion opportunity tracking, support trends, and account timelines.
Executive Analytics Platforms
Executive analytics gives founders, investors, and leadership teams a higher-level view of the business. Think KPI summaries, growth trends, forecasts, cohort snapshots, board reports, and clean board-style summaries that do not require twenty minutes of explanation.
The goal is not to hide detail. It is to put detail one click away.
Good executive dashboards answer the first question fast, then let people drill down when the second question appears. And it always appears.
Embedded Analytics for SaaS
Embedded analytics lives inside the SaaS product itself. Customers use it directly.
This is common in CRM, logistics, fintech, marketing, HR, developer tools, and operations platforms. A customer logs in and sees their own performance: campaigns, shipments, team activity, financial trends, usage, compliance, or whatever the product manages.
Here, analytics software for SaaS is not internal reporting. It is a feature customers may pay for. That raises the bar for UX, permissions, speed, exports, and tenant-level data security.
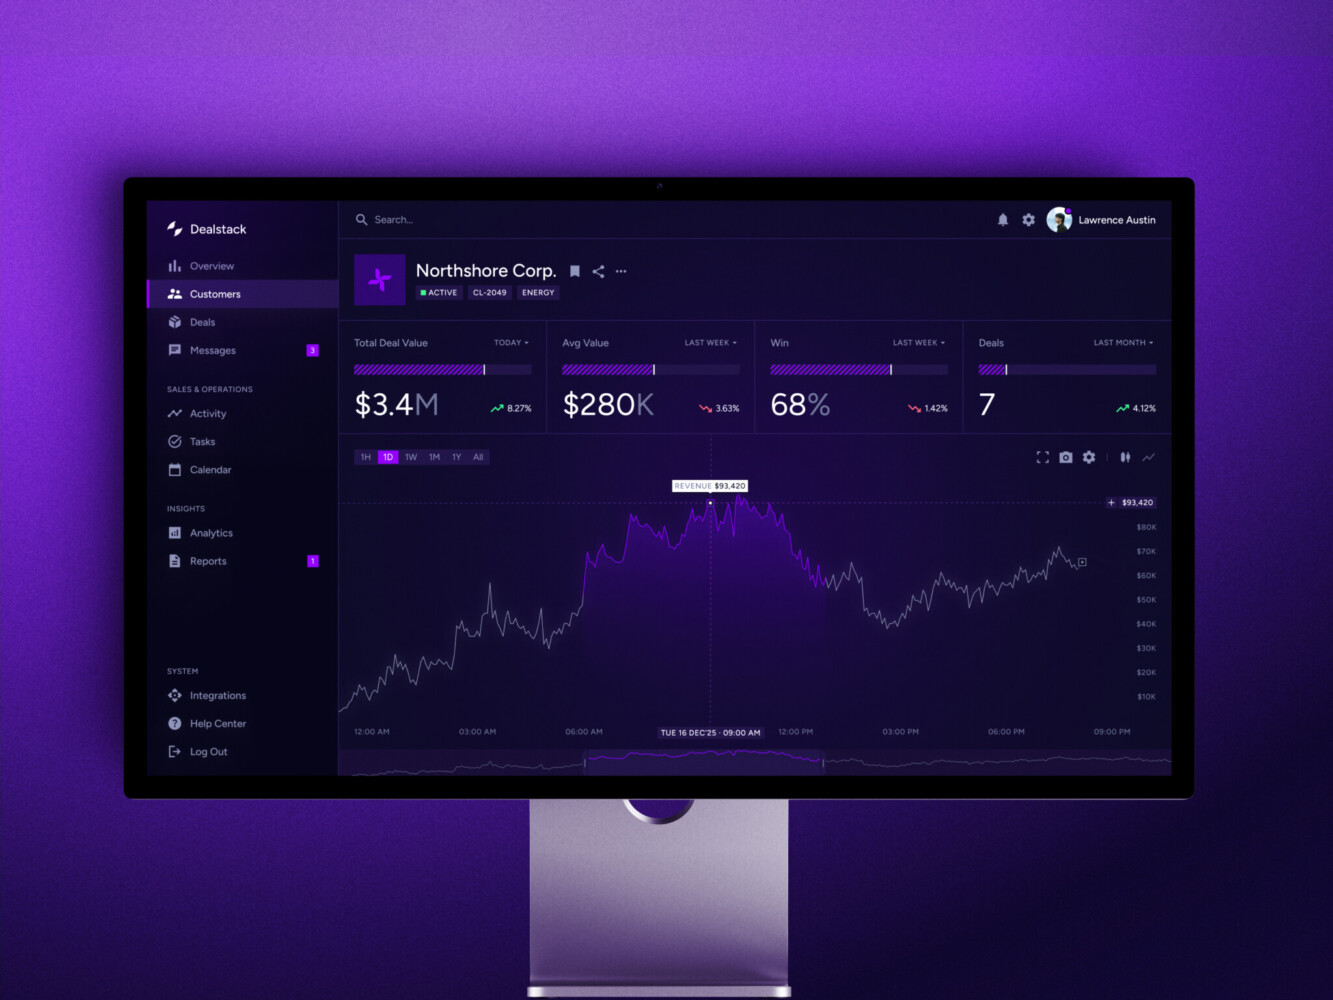
Sales Analytics Dashboard by Shakuro
Core Features
Feature lists can get silly fast, so let us stay close to what teams really need.
Data Integration
The platform needs to pull data from billing APIs, CRM systems, product tracking, support tools, marketing platforms, warehouses, databases, webhooks, and sometimes old internal systems with surprisingly heroic names.
Integrations are not glamorous work. They are also where many analytics projects live or die. A dashboard that looks nice but imports half the records late is just a pretty source of stress.
Metric Layer
The metric layer defines how the business calculates active users, churn, MRR, ARR, upgrades, downgrades, expansion, plan changes, trial conversion, account health, and other SaaS metrics.
This layer matters for a SaaS metrics dashboard because teams need consistency. If “active account” means one thing in product meetings and another thing in customer success reports, your dashboard examples may look polished, but the business still has a vocabulary problem.
Custom Dashboards
Different teams need different views.
Founders need trend summaries. Finance needs revenue detail. Product needs funnels and cohorts. Customer success needs account health. Sales needs expansion signals. Investors need a clean story that survives scrutiny.
Role-based dashboards keep people focused. They also prevent the classic analytics mistake: one monster dashboard with fifty charts and no clear first move.
Cohort and Funnel Analysis
Cohorts show how groups behave over time. Funnels show where people drop off. Together, they answer some of the most useful SaaS questions:
- How many trial users reach activation?
- Which acquisition channels bring customers who stay?
- Do users who adopt Feature A retain better after month three?
- Is churn higher for accounts that skip onboarding?
This is where analytics becomes more than reporting. It starts shaping product strategy.
Churn and Retention Analytics
Churn rarely appears out of nowhere. Low usage, failed payments, fewer key users, delayed onboarding, support frustration, downgrade behavior, and quiet accounts often show up first.
A SaaS reporting platform catches these signals early. Not with magical certainty, because come on, customers are people. But with enough pattern recognition to help teams act before the renewal date turns into bad news.
Revenue Forecasting
Revenue forecasting can include MRR forecasts, ARR growth projections, expansion models, churn-adjusted scenarios, and sales pipeline inputs.
The useful version is honest about uncertainty. A forecast should help leadership compare likely paths, not pretend the future is already signed in DocuSign.
User and Account Segmentation
Segmentation lets teams compare groups by plan type, company size, industry, acquisition channel, lifecycle stage, region, feature usage, or contract value.
This is one of those features that looks ordinary until you need it. Then it becomes everything. Averages hide too much. Segmenting by customer type can show that one group loves the product while another quietly churns after onboarding.
Alerts and Automated Reports
Slack alerts, email summaries, anomaly detection, weekly reports, renewal-risk notices, and account health notifications keep analytics from becoming a place people visit only before meetings.
But alerts need restraint. Too many notifications and everyone develops alert blindness. I have seen teams mute the very channel that was supposed to save them time. Well, you know how that goes.
Security and Access Control
Analytics for products often touches sensitive customer and revenue data. The analytics SaaS platform needs role-based access control, tenant-level permissions, audit logs, encryption, SSO, and a clear path toward SOC 2, GDPR, and CCPA requirements when those apply.
Security is not a feature to add at the end. It affects the data model, APIs, dashboard access, exports, logs, and admin workflows from day one.
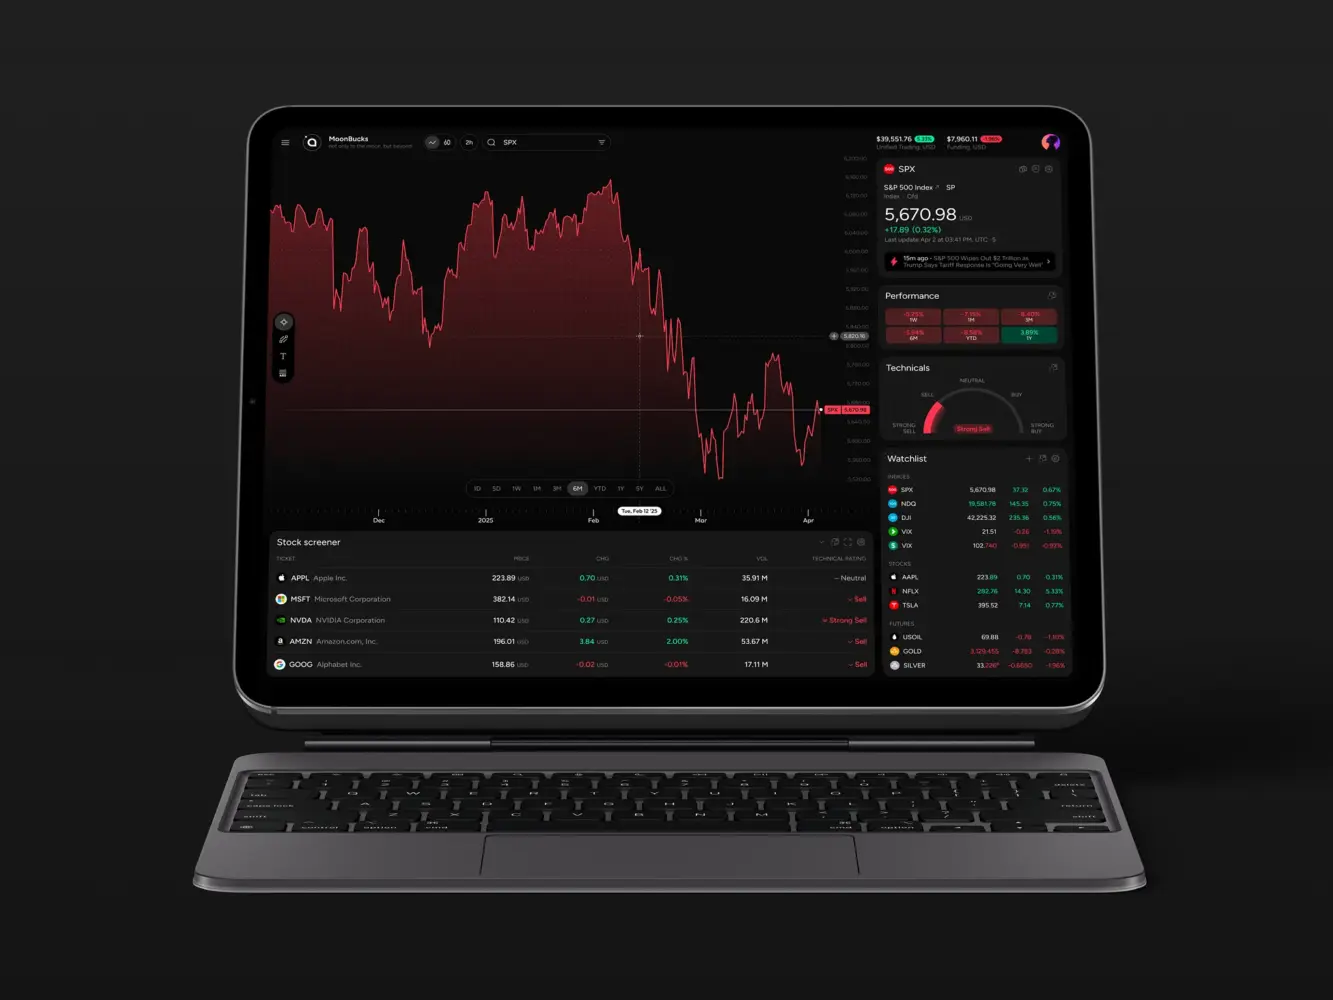
Financial Market Trading Analytics Tool Dashboard Design by Shakuro
Architecture for SaaS Analytics
The architecture depends on scale, speed, budget, and whether analytics is internal or customer-facing. Still, most systems share a familiar shape. Data sources feed the platform: billing, product events, CRM, marketing, support, application databases, and external APIs.
- The ingestion layer moves data through API connectors, webhooks, event streams, and batch imports.
- The storage layer keeps raw and processed data in a warehouse, data lake, operational database, or some mix of these.
- The transformation layer cleans, normalizes, joins, validates, and calculates metrics.
- The analytics layer powers dashboards, reports, forecasts, cohorts, segmentation, and alerts.
- The API layer exposes data to internal tools or customer-facing features.
- The frontend layer gives users dashboards, tables, charts, filters, exports, saved views, and drill-downs.
Simple on paper. A bit fussy in real life. The big architectural question is usually this: warehouse-first or application-first?
A warehouse-first setup works well when the company already has multiple data sources and needs reliable historical reporting. Tools like BigQuery, Snowflake, Redshift, dbt, Airbyte, and Fivetran often fit here.
An application-first setup can work for embedded analytics or MVPs where data lives closer to the product database. It may use PostgreSQL, custom APIs, caching, background jobs, and a smaller reporting layer.
A custom analytics SaaS platform with real-time features adds another decision. Kafka, event streams, and live updates make sense for alerts, trading, logistics, monitoring, or operational dashboards. But not every metric needs to update every second. Daily MRR does not become wiser because it refreshes every ten seconds. It just becomes more expensive.
Recommended Tech Stack Examples
There is no single best stack for this type of build. Anyone who says otherwise is probably selling a stack.
Common choices include:
- Backend: Python, FastAPI, Node.js, Go.
- Frontend: React, Next.js.
- Database: PostgreSQL.
- Warehouse: BigQuery, Snowflake, Redshift.
- Pipelines: Airbyte, Fivetran, dbt, Kafka.
- Visualization: custom dashboards, Metabase, Superset, Looker.
- Infrastructure: AWS, GCP, Azure, Docker, Kubernetes.
For an MVP, keep the stack boring in the best way. Use tools your team can operate. Fancy architecture is fun during planning and painful at 2 a.m. when a customer report fails.
For enterprise SaaS, invest earlier in permissions, audit logs, tenant isolation, data contracts, lineage, monitoring, and query performance. These things are hard to bolt on later.
Dashboard Design for Stock Trading Platform by Shakuro
SaaS Analytics Platform Development Process
Building analytics software is not just “connect data and draw charts.” The development process needs product thinking, data engineering, backend logic, UX design, and testing that treats numbers as product behavior.
Discovery and Data Strategy
Start with business goals and metric definitions.
What decisions should the platform support? Which teams use it? Which numbers matter weekly? Which data sources are trustworthy? Which ones need cleanup? What does churn mean here? What counts as activation? Do paused subscriptions count as churn? Annoying questions, yes. Also necessary.
This stage prevents a lot of expensive rework.
UX/UI Design
Dashboard UX is its own craft. Data-heavy interfaces need hierarchy, filtering, drill-downs, empty states, loading states, exports, accessibility, and mobile views that do not feel like punishment.
The design should start with decisions, not decoration. If the user opens a dashboard, what are they trying to decide? Renew an account? Investigate churn? Report to the board? Prioritize a product fix? The answer shapes the layout.
Architecture Planning
This is where the team chooses build vs. buy components, warehouse-first vs. app-first structure, batch vs. real-time processing, tenant model, permission logic, API strategy, and infrastructure.
Do not rush it. A weak architecture can make every later feature slower.
Data Pipeline Development
Pipelines move and prepare the data. They need connectors, event tracking, ETL or ELT workflows, validation, retries, error handling, logging, and monitoring.
The unglamorous part again. But when it works, everyone trusts the dashboard more. When it does not, even a beautiful chart feels suspicious.
Backend and API Development
The backend handles metric calculations, segmentation, report generation, authentication, permissions, data access, integrations, scheduled jobs, and sometimes export logic.
This is the stage of SaaS analytics platform development where teams need to protect metric definitions. If every dashboard calculates MRR slightly differently, the platform slowly turns into a debate club.
Dashboard and Data Visualization Development
Here the product becomes visible: KPI cards, trend charts, cohort tables, funnel charts, health views, executive summaries, account pages, filters, and exports.
Good visualization does not mean more charts. It means the right chart at the right moment. Sometimes a table is better. Sometimes a single number with a clear comparison beats a full screen of color.
Testing and Data Validation
Analytics testing has a special flavor because visual bugs are only half the story. The numbers must be right.
Teams should test metric accuracy, billing reconciliation, data freshness, role-based access, tenant isolation, load behavior, browser support, API reliability, and edge cases like refunds, trials, reactivations, plan changes, and failed payments.
Yes, it is a lot. It is still cheaper than explaining the wrong ARR number in a board meeting.
Deployment and Scaling
Deployment includes CI/CD, cloud setup, monitoring, logging, autoscaling, backup strategy, query optimization, cost control, and post-launch iteration.
After launch, the platform should keep improving. Teams learn which dashboards people use, which alerts get ignored, which reports need more context, and where performance starts to drag.
Management Dashboard by Shakuro
Cost of SaaS Analytics Platform Development
| Platform Type | Typical Scope | Timeline | Estimated Cost |
| MVP analytics platform for SaaS | 3 to 5 integrations, core metrics, basic revenue analytics, simple product usage reports, authentication, and an admin panel. | 3 to 5 months | $60,000 to $180,000 |
| Mid-level analytics platform for SaaS | Custom metric layer, cohort analysis, churn dashboards, customer health scoring, role-based dashboards, scheduled reports, and warehouse integration. | 5 to 9 months | $180,000 to $450,000 |
| Enterprise analytics platform for SaaS | Multi-tenant analytics, embedded customer dashboards, real-time processing, predictive analytics, advanced permissions, audit logs, compliance-ready infrastructure, and custom integrations. | 9 to 18+ months | $450,000 to $1,500,000+ |
Costs depend on scope, integrations, data volume, permissions, UX complexity, and whether analytics is internal or embedded in the product.
For a rough planning range:
- MVP analytics platform for SaaS: 3 to 5 months, about $60,000 to $180,000. This usually covers 3 to 5 integrations, core metrics, basic revenue analytics, simple product usage reports, authentication, and an admin panel.
- Mid-level analytics platform for SaaS: 5 to 9 months, about $180,000 to $450,000. This can include a custom metric layer, cohort analysis, churn dashboards, customer health scoring, role-based dashboards, scheduled reports, and warehouse integration.
- Enterprise analytics platform for SaaS: 9 to 18+ months, about $450,000 to $1,500,000+. This can include multi-tenant analytics, embedded customer dashboards, real-time processing, predictive analytics, advanced permissions, audit logs, compliance-ready infrastructure, and custom integrations.
The sneaky cost is not always development. Sometimes it is data cleanup. Sometimes it is aligning teams around definitions. Sometimes it is rebuilding a pipeline because the first version assumed the business would stay smaller. Businesses rarely stay polite like that.
Common Challenges in SaaS Analytics Platform Development
Data Quality
Different systems collect data in different ways. Some records are missing. Some IDs do not match. Some events fire twice. Some invoices get edited after the fact.
Data quality work feels slow, but it gives the platform its backbone.
Metric Definition Conflicts
Sales, finance, product, and customer success may define the same metric differently. This is normal. It just has to be resolved before the dashboards become official.
Write the definitions down. Put them in the product. Treat them like part of the system, because they are.
Real-Time vs Batch Tradeoffs
Real-time sounds good, doesn’t it? It can be. During cloud analytics platform development, it can also cost more, break more often, and create noise where a daily update is enough.
Use real-time for things that need immediate action: fraud signals, operational alerts, trading activity, live logistics, system monitoring, and urgent account risks. Use batch processing for slower business metrics.
Multi-Tenant Data Security
Multi-tenant analytics must prevent data leakage across customers, teams, roles, and permission levels. This affects the database, APIs, caching, exports, dashboards, admin tools, and logs.
If analytics is embedded into a SaaS product, tenant isolation becomes one of the most important parts of the build.
Dashboard Overload
Too many charts make people tired. They scan, shrug, and leave.
A strong SaaS reporting platform guides attention. It shows the metric, gives context, and suggests the next useful question. You do not need to impress users with chart density. You need to help them move.
Scalability and Cost
As the product grows, data grows with it. Queries slow down. Warehouse bills rise. Dashboards that once loaded instantly start to feel sticky.
Common fixes include partitioning, caching, aggregation tables, materialized views, query optimization, and a better data model. Not glamorous. Really helpful.
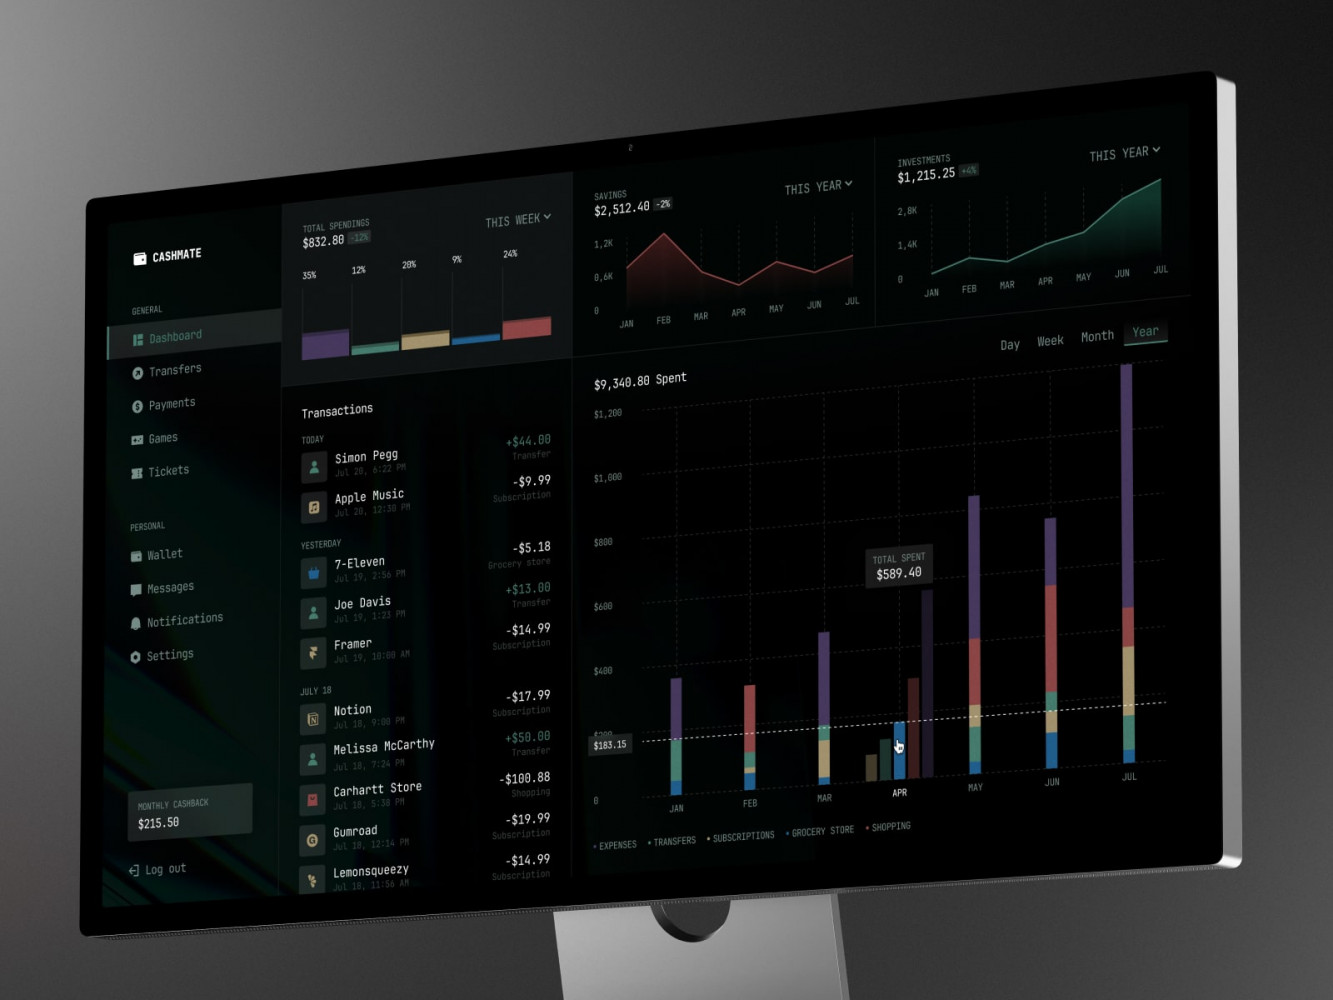
Finance Management Web Dashboard by Conceptzilla
Our Experience in SaaS and Analytics Platform Development
Much of Shakuro’s work sits near data-heavy SaaS, fintech, and operational products, where the interface has to make complex information readable without flattening it into toy charts.
Two projects show this well.
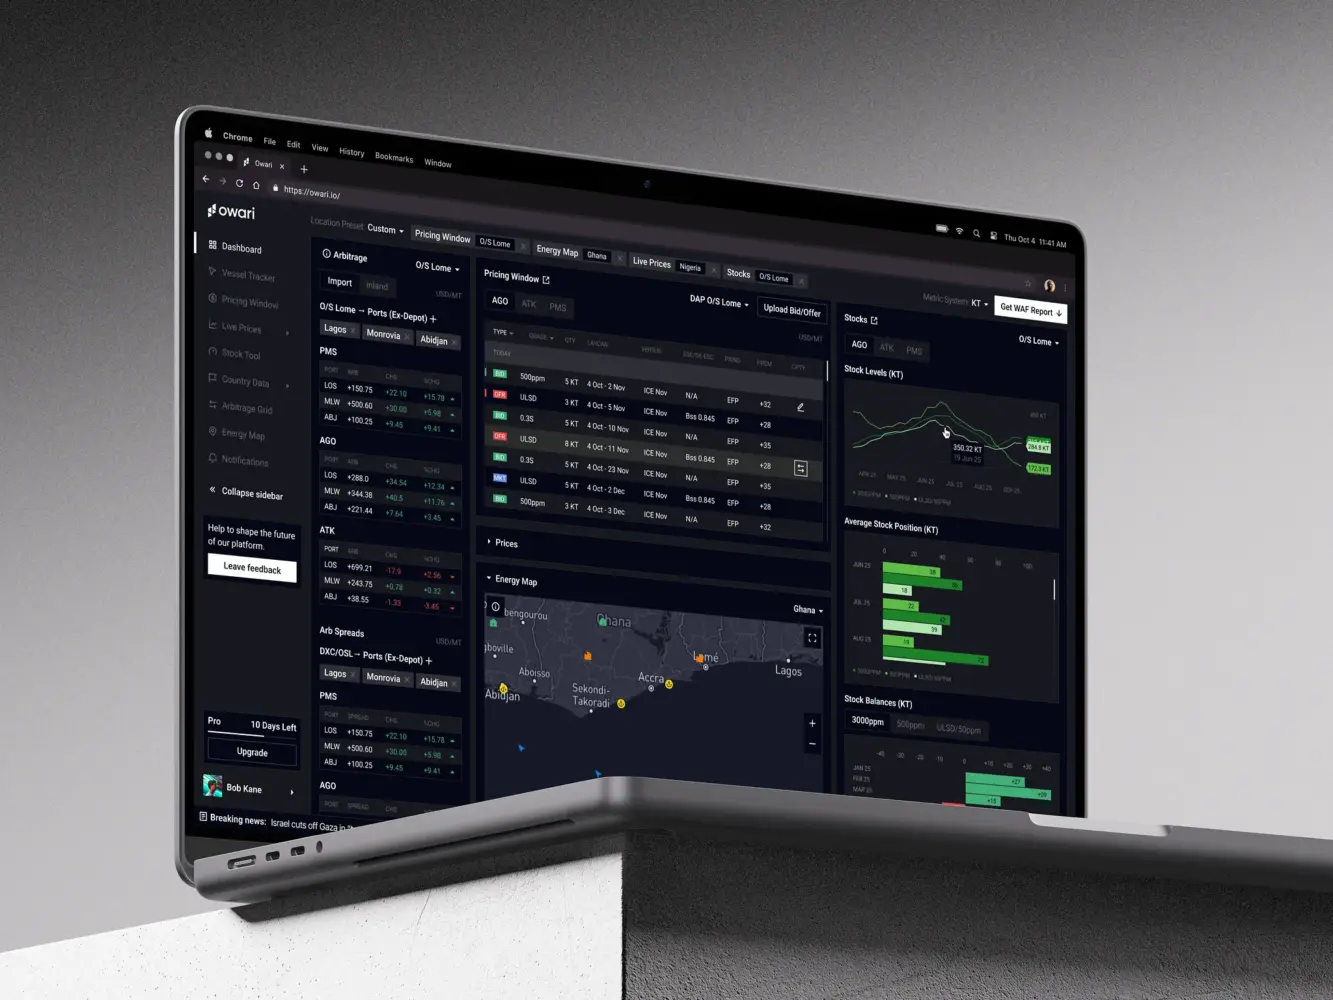
Owari: Create Analytics for West African Oil and Gas Markets
Owari is a digital SaaS platform for West African oil and gas markets. It helps traders, brokers, and analysts uncover opportunities and manage risk through connected data, real-time algorithms, complex tables, dashboards, vessel tracking, maps, and data visualization.
The interesting part here is the seriousness of the data. This is not a casual dashboard someone checks over coffee and forgets. Users make decisions from it. The analytics software for SaaS needs speed, clear hierarchy, and trust.
Owari is a good example of analytics architecture meeting interface design. The product includes dashboard views, stock levels, country data, vessel tracking, an energy map, and dark mode for dense data work. The case also shows something teams sometimes underestimate: visual clarity is part of data quality. If users misread a chart, the system has failed them even if the database is correct.
TraderTale: Turn Trading Data Into Clear Dashboards
TraderTale is a fintech SaaS platform where trading performance becomes part of a user profile. It brings together reputation, levels, leaderboards, alerts, detailed trade views, filters, profiles, advanced stats, and visual comparison.
The product has a different mood than Owari. It turns behavior into identity. That means the interface has to stay credible for financial data while still giving users a reason to return.
The leaderboard, for example, is not only about profit. It looks at consistency. Alerts work as a real-time feed with filters and detailed views. Profiles combine portfolio highlights, trading style, performance history, and comparison. Raw data becomes a social product surface.
That is a useful lesson for subscription products in general. Analytics does not have to sit in a reporting corner. It can become part of the product’s value.
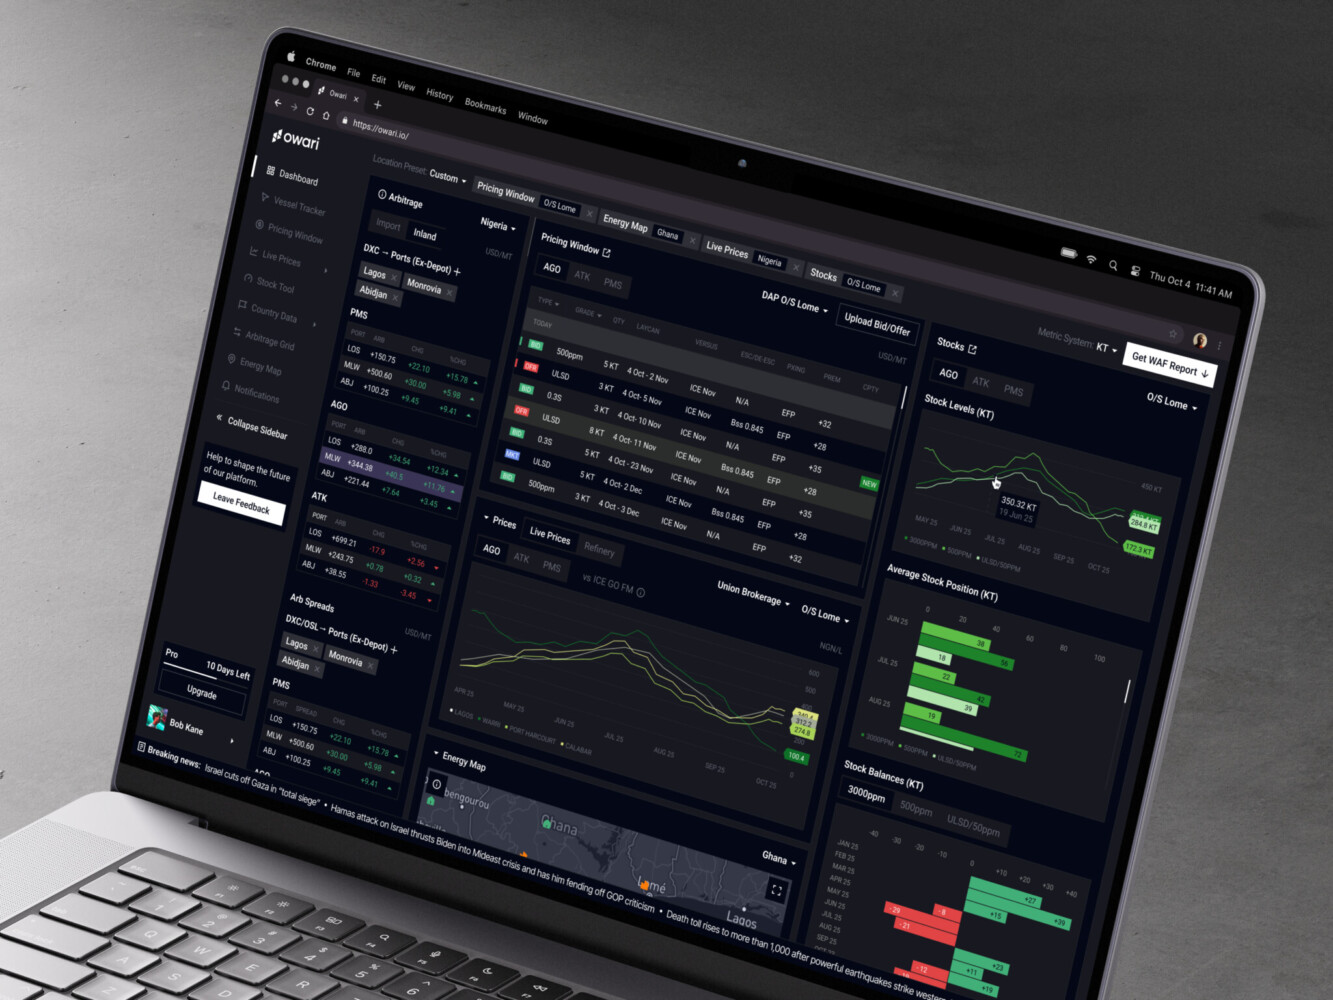
Owari dashboard by Shakuro

Why Work with a SaaS Analytics Platform Development Company
This kind of platform touches too many parts of the business to treat it as a quick dashboard task.
SaaS analytics developers can help with metric logic, lifecycle behavior, scalable architecture, dashboard UX, data integrations, security, tenant permissions, and MVP planning. More importantly, a good team helps avoid the early choices that look harmless but become expensive later.
Custom analytics work needs product sense and engineering patience. You need people who can discuss churn definitions with finance, event tracking with product, permissions with enterprise buyers, and chart hierarchy with designers without making the room feel heavier than it already is.
That mix really helps.
Final Thoughts
The analytics SaaS platform is a decision system.
It connects product behavior, revenue, retention, and customer health. It gives teams shared language. It shows where growth is real, where it is fragile, and where customers need attention before they quietly leave.
Start with metric definitions. Build around data quality. Keep architecture scalable, but not showy. Design dashboards around decisions, not decoration.
And if your team is already juggling product data, billing exports, CRM notes, support signals, and board reports by hand, well, that is probably the sign. The spreadsheet phase did its job. Now the business needs something sturdier.
Need help designing or building analytics for a SaaS product? Contact Shakuro and let’s talk through the product, the data, and the decisions your team needs to make faster.
FAQ
What is SaaS analytics platform development?
It’s the process of building software that lets SaaS companies track, visualize, and analyze user behavior and business metrics within their own product. Instead of just sending data to third-party tools like Mixpanel or Amplitude, you embed custom dashboards directly into your app so customers can see their own usage stats, ROI, or performance data in real time.
How much does it cost to build a SaaS analytics platform?
Anywhere from $60k for a bare-bones MVP to over $1.5M for a full-scale enterprise system. The price tag depends entirely on whether you need simple usage reports or complex features like real-time processing, predictive modeling, and multi-tenant architecture.
How long does SaaS analytics platform development take?
3 to 18+ months. A basic MVP takes 3–5 months, mid-level features push it to 5–9 months, and complex enterprise systems with real-time or predictive capabilities require 9–18 months or more.
What is the difference between a SaaS analytics platform and a BI dashboard?
A BI dashboard is for your internal team to analyze business data. A SaaS analytics platform is embedded directly into your product so your customers can view and interact with their own data.