
For those who prefer to listen rather than read, this article is also available as a podcast on Spotify.
Contents:
Most companies don’t wake up one day and decide they need an AI analytics platform. The need usually appears much earlier, inside messy product and business questions that regular reports can’t answer well enough.
Why do some customers convert only after the third or fourth interaction, while others disappear after one session? Which user behavior actually predicts churn, and which metrics only look important on a dashboard? Why does revenue grow in one segment but stay flat in another? Which operational decisions could be automated instead of reviewed manually every week? Are teams reacting to old reports, or are they working with signals that show what is likely to happen next?
These are the kinds of questions that push companies beyond traditional analytics. Standard dashboards are useful when a team needs to see what happened. But growing products often need more than historical reporting. They need systems that can process large volumes of data, detect patterns, surface risks, recommend next steps, and support faster decision-making across product, sales, finance, operations, or customer success.
That is where AI analytics platform development comes in. A custom AI analytics platform combines data engineering, machine learning, real-time analytics, and interface design into one connected system. Instead of leaving data scattered across CRMs, product analytics tools, transaction records, support platforms, and spreadsheets, it turns that data into structured insight people can actually use.
For founders, CTOs, and product managers, the value is not “AI” as a label. The value is practical: better forecasting, smarter segmentation, automated anomaly detection, predictive recommendations, cleaner reporting, and faster access to the signals that matter. In a SaaS product, this may mean identifying accounts likely to churn. In fintech, it may mean detecting unusual transaction behavior or building richer financial intelligence tools. In eLearning, it may mean understanding which learning paths lead to completion and which ones quietly lose users.
Building such a system is not only a machine learning task. It also requires solid backend architecture, reliable data pipelines, thoughtful UX, and frontend interfaces that make complex information readable. That is why teams often combine AI development expertise with strong web development capabilities: the model is only useful if the surrounding product can collect, process, explain, and deliver its output in the right context.
This guide looks at how a machine learning analytics platform works from the inside: its core architecture, key components, development process, machine learning layer, real-time analytics logic, and dashboard design principles. It also covers the challenges companies usually face when building intelligent data analytics systems, from data quality and integration to scalability, security, and model maintenance.
We will also look at how AI analytics connects with broader product categories, including SaaS platforms and fintech products, where analytics often becomes part of the product’s core value rather than a supporting feature.
What Is an AI Analytics Platform?
A predictive analytics platform development is what companies usually start thinking about when ordinary reporting begins to slow them down.
At first, a dashboard is enough. A founder checks revenue. A product manager looks at activation. A sales team watches conversion. A finance team exports reports before a meeting. Everyone has numbers, and for a while, that feels like control.
Then the product grows. Data starts coming from too many places: the app, CRM, payment system, support tool, marketing channels, spreadsheets, third-party services. Different teams look at different reports and argue about which number is correct. A drop in activity is noticed after it has already affected revenue. A risky user pattern is visible in the data, but nobody sees it in time.
This is the gap an AI analytics platform is meant to close.
In simple terms, it is a system that collects data, prepares it for analysis, applies machine learning where it makes sense, and presents the result in a way people can actually use. That result may be a forecast, an anomaly alert, a churn-risk score, a recommendation, a user segment, or a dashboard that changes as new data comes in.
The key difference from traditional BI is the type of question the system helps answer. Business intelligence tools are mostly built around the past. They show what happened: sales dropped, traffic grew, engagement changed, one user group performed better than another. This is still useful, but it often stops right before the most important part.
AI analytics software goes further into interpretation. It helps teams understand what may happen next, where the risk is coming from, and which signals deserve attention first. For example, a BI report can show that paid users became less active. An AI analytics system can show which accounts changed behavior, how similar patterns ended in the past, and which customers are now more likely to churn.
There are several common forms of custom AI analytics software.
The first is business intelligence with AI. This is the most familiar version for many teams. It still looks like a reporting system, with dashboards, charts, filters, and tables. The difference is that the platform can also highlight unusual changes, add predictive metrics, summarize trends, or point out which numbers are worth checking first. It is not a replacement for BI, but a more useful version of it.
The second type is predictive analytics platforms. These are built around forecasts: churn, revenue, demand, risk, user activity, conversion, customer lifetime value, and other metrics that affect planning. This type of AI analytics platform development makes sense when a company already has enough historical data and wants to use it for decisions, not just reports.
The third type is real-time analytics systems. They process data as it appears and turn it into live dashboards, alerts, or automated actions. This is important in products where waiting until tomorrow’s report is too late: trading tools, payment systems, logistics platforms, marketplaces, transaction monitoring products, and financial data platforms.
Under the hood, most AI analytics platforms have the same basic structure.
Data pipelines come first. They move information from different sources into one clean flow. It is not the most visible part of the product, but it decides whether the rest of the system can be trusted.
Machine learning models are added when simple rules are not enough. They can predict outcomes, detect anomalies, classify users, group behavior patterns, or recommend the next best action. The important thing is that the model has to answer a real business question. “Which customers are likely to leave?” is a real question. “Let’s add AI to the dashboard” is not.
The analytics engine connects the data, business logic, and model results. It calculates metrics, applies rules, checks thresholds, builds segments, and prepares insights for dashboards, alerts, APIs, or internal workflows.
Dashboards and visualization make the system usable. A good AI analytics dashboard does not try to show every possible chart. It helps people see what changed, why it matters, and where they should look next.
API integrations connect the platform with the rest of the company’s tools: SaaS products, CRMs, payment providers, support systems, internal admin panels, or third-party data sources. Without this layer, analytics becomes another separate place people have to remember to check. With it, insights can appear directly inside the workflow where decisions are made.
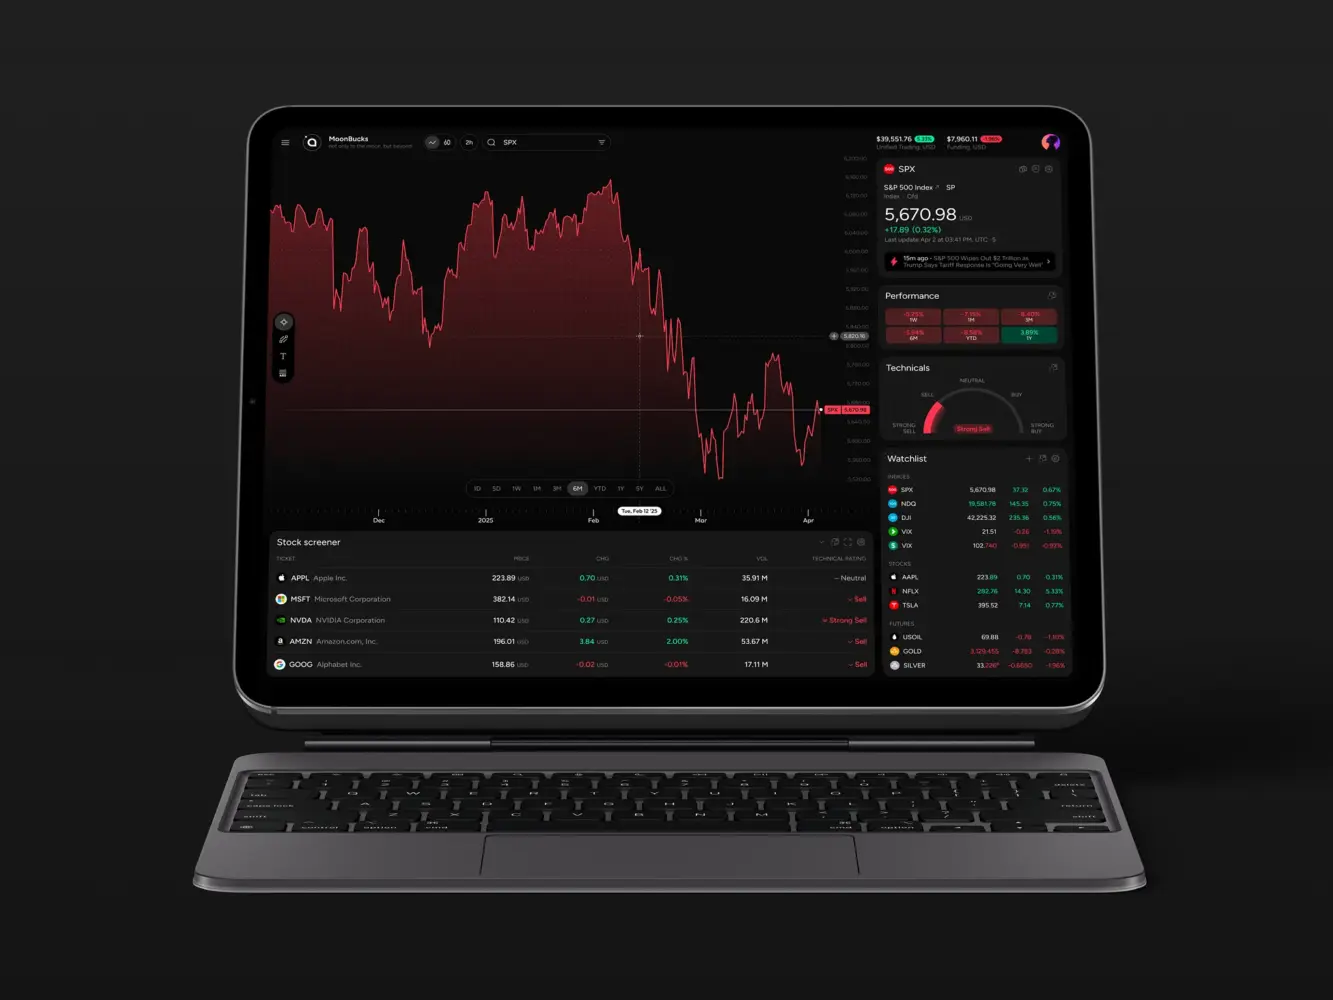
Financial Market Trading Analytics Tool Dashboard Design by Shakuro
Key Features of AI Analytics Platforms
Data Integration and Processing
The first serious feature is not AI at all. It is the ability to get data from different places and make it usable.
In most companies, data is not waiting in one perfect database. Product events sit in the application. Payments live in a billing system. Customer data is split between a CRM, support tools, admin panels, and sometimes spreadsheets that nobody wanted to become permanent but did anyway. There may also be APIs, partner systems, marketing tools, or third-party data providers.
An AI analytics platform has to connect all of this before it can produce anything trustworthy. It needs to pull data from databases, APIs, and external systems, clean it, remove duplicates, align formats, and prepare it for analysis.
This part is easy to underestimate because users rarely see it. But it decides whether the whole product works. If “active user” means one thing in the product database and another thing in the CRM, the dashboard will not solve the problem. It will only make the confusion look more official.
Machine Learning Models
Machine learning should not be treated as decoration. It has to do a specific job inside the system.
In AI analytics platforms, that job is often prediction. A model can help estimate which customers are likely to churn, which users may convert, which accounts are ready for expansion, or where demand may rise or fall. The result does not need to be perfect to be valuable. Even a probability score can help a team decide where to look first.
Another common use case is anomaly detection. Instead of waiting for a manager to notice that something feels off, the system can flag unusual behavior: a sudden drop in activity, a strange payment pattern, an unexpected traffic spike, or a transaction that does not match the usual flow.
Recommendation systems can also be part of the product. For a customer success team, that could mean a list of accounts worth checking today. For a product team, it could mean a segment that is more likely to adopt a new feature.
The simplest test is this: can you describe what the model is supposed to decide or detect? If the answer is vague, the feature is probably not ready.
Real-Time Analytics
Real-time analytics is not necessary for every product. Some reports can update once a day and still do their job perfectly well.
But there are products where timing changes everything. A suspicious transaction, a sudden usage drop, a trading signal, a failed payment, a pricing change, or a system anomaly may lose value if someone sees it tomorrow morning.
That is where real-time analytics systems come in. They process streaming data as events happen and turn it into live dashboards, alerts, or automated actions.
This is common in fintech, trading software, logistics platforms, marketplaces, monitoring tools, and large SaaS products. The point is not to make every number move on the screen in real time. The point is to catch the few signals that should not wait.
The hard part is filtering. If the system reacts to everything, people stop listening. Real-time analytics only works when the product can separate noise from events that actually need attention.
Interactive Dashboards
A dashboard is not just a place to put charts. It is the part of the platform where people decide whether they trust the system.
A good dashboard gives users a clear path from “something changed” to “here is what I should check next.” A founder may want revenue, growth, and risk signals. A product manager may need funnels, cohorts, and feature usage. A finance team may care about forecasts, anomalies, and transaction details.
The mistake is trying to show everything at once. Dense dashboards may look impressive in a demo, but they are exhausting in daily work. Users need filters, segments, drill-downs, clear labels, and enough explanation to understand why a model produced a certain score or alert.
This is where product design matters as much as engineering. Strong UI/UX design helps turn complex analytics into something people can work with, while frontend development keeps the interface fast and stable. For web-based products with many interactive views, React development is often a practical fit because it supports reusable components and responsive dashboard logic.
Automation and Alerts
The final layer is automation. Not everything should wait for someone to open a dashboard.
Automated reports can handle the repetitive work: weekly summaries, metric changes, risk updates, performance reviews, or department-level snapshots. Instead of rebuilding the same report every Friday, the team receives a consistent version with the important changes already highlighted.
Alerts are more urgent. They should appear when a metric crosses a threshold, a forecast changes, a model finds suspicious behavior, or an important account needs review.
The danger is obvious: too many alerts become noise. A useful alert is not just “something happened.” It should explain what changed, why it matters, and where the user should go next.
Automation works best when it leads to an action. An alert can create a task, open an account profile, notify the right person, send data to another tool, or trigger a review flow. That is when analytics becomes part of the work itself, not another tab people forget to check.
AI Analytics Platform Development Process
1. Data Strategy and Use Case Definition
AI analytics platform development should not start with a model. It should start with a problem that has become too annoying, too slow, or too expensive to solve manually.
Maybe the product team does not understand why good users suddenly stop coming back. Maybe the sales team has a CRM full of activity, but still cannot tell which accounts are actually moving toward a deal. Maybe finance has the numbers, but forecasting still feels like educated guessing. Maybe support tickets, payments, product events, and marketing data all describe the same customer from different angles, and nobody has a full view.
That is usually where the project begins.
Before writing requirements, the team needs to define the use case in plain language. Not “we need AI-powered analytics,” but “we need to know which customers are likely to churn,” “we need to forecast demand,” “we need to detect suspicious transactions,” or “we need to see which actions lead to long-term retention.”
This step also decides what data the platform will need. It may be product events, CRM records, billing history, payment data, support tickets, marketing data, transaction logs, learning activity, or external APIs. In most real projects, the answer is not pretty. Some data is clean, some is duplicated, some is stored in the wrong format, and some important fields were never tracked properly in the first place.
That is not a reason to stop. It is a reason to find it early.
The same applies to metrics. Teams often discover that basic terms are not as obvious as they seemed. What counts as an active user? Is a customer churned after canceling, after not logging in, or after failing to renew? What makes a lead qualified? What exactly is a completed transaction?
These definitions need to be fixed before the first dashboard appears. Otherwise, the product may look finished while still answering the wrong question.
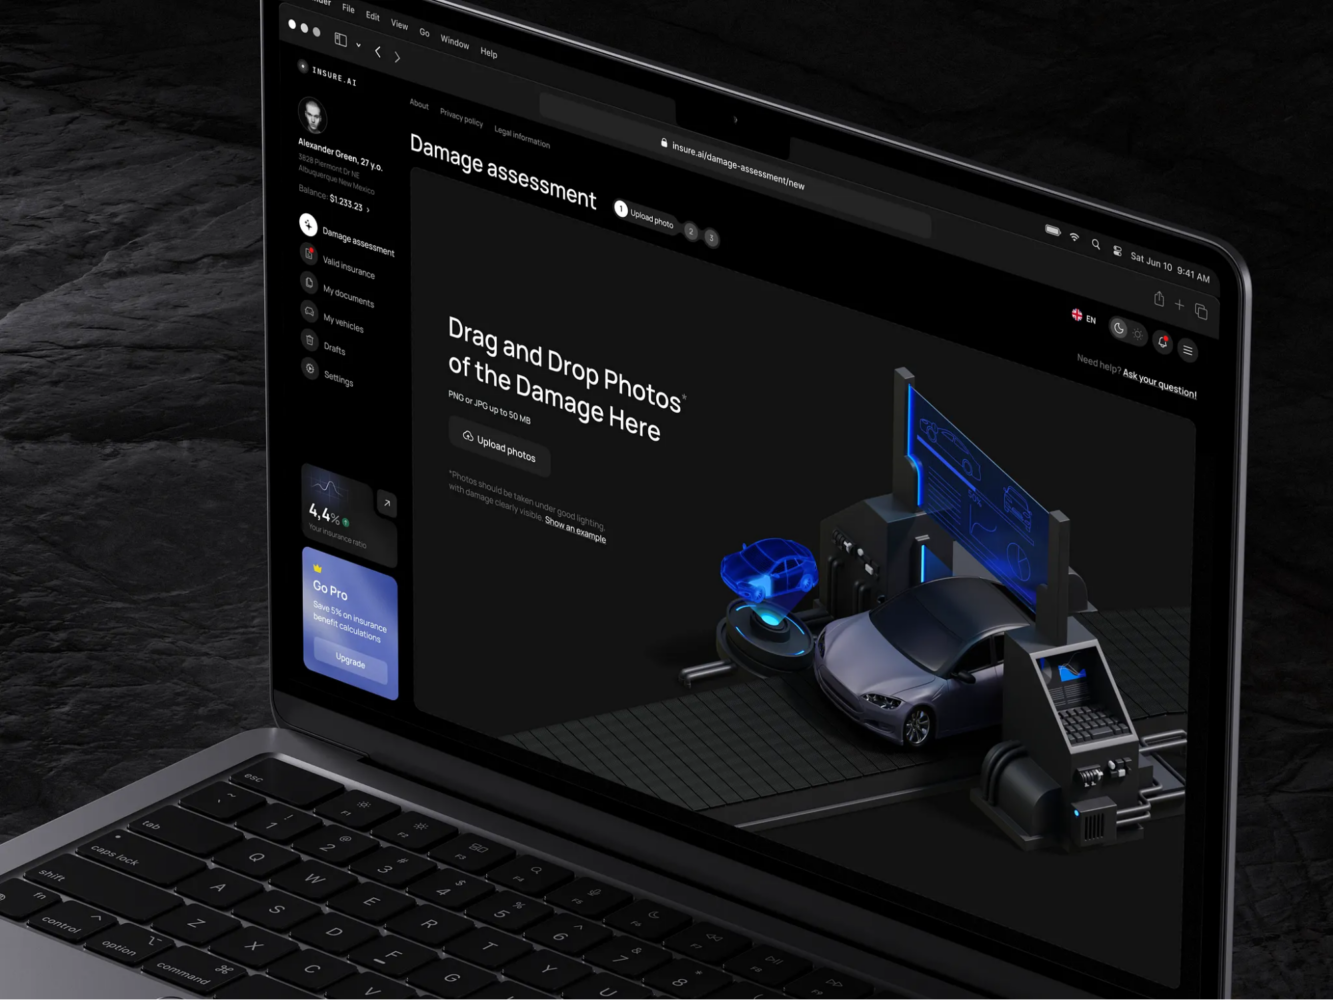
AI Insurance Design Concept by Shakuro
2. UX/UI Design for Analytics Platforms
Analytics dashboards often become messy for a very simple reason: every team wants its own chart.
The founder wants growth and revenue. Product wants cohorts and funnels. Finance wants forecasts. Customer success wants account health. Risk wants anomalies. Marketing wants attribution. Each request is reasonable on its own. Together, they can turn the interface into a control panel nobody wants to touch.
Good UI/UX design for analytics starts with deciding who needs what first. A dashboard should not treat every user as if they have the same job, the same level of context, and the same amount of time.
A founder may need the shortest possible view of the business: what changed, whether it matters, and where the risk is. A product manager may need to open a funnel and compare user groups. A finance team may need to check forecast changes and revenue anomalies. A customer success manager may only need a clear list of accounts worth reviewing today.
The design should guide the user through the logic of the data. First: what happened? Then: where did it happen? Then: which segment, account, transaction, or time period is involved? Only after that should the interface offer deeper details.
This is especially important when machine learning is involved. A churn score, forecast, or anomaly alert cannot just appear on the screen and expect trust. Users need some context around it: what influenced the result, how strong the signal is, and where they can check the underlying data.
The best analytics interfaces are usually quieter than people expect. They do not try to show everything. They show the first useful thing, then let the user go deeper when needed.
3. Choosing the Technology Stack
The technology stack should follow the product, not the pitch deck.
A dashboard that updates once a day does not need the same architecture as a real-time fintech system. An internal reporting tool for one team does not need the same setup as a SaaS analytics product with roles, permissions, integrations, and large data workloads.
For backend development, Python and Node.js are common choices. Python is often used for AI analytics products because it works well with data processing, machine learning, and model experimentation. When the system needs APIs for dashboards, integrations, and model results, Python development can be paired with FastAPI development to keep services clear and relatively easy to maintain.
For machine learning, TensorFlow and PyTorch may be used for forecasting, classification, anomaly detection, and recommendation systems. But they should not be treated as mandatory. Sometimes a simpler model is better because the team can explain it, test it, and maintain it without turning every update into research work.
For data processing, Kafka is useful when the product needs to work with streaming events. Spark can help with larger datasets and heavier processing jobs. Both are strong tools, but they add operational weight, so they should appear only when the scale or speed requirements justify them.
On the frontend, React is often a practical choice for analytics dashboards because these interfaces usually need filters, tables, charts, drill-downs, reusable components, and role-based views. PostgreSQL can work well for structured application data. BigQuery is often used when the platform needs larger analytical workloads and reporting.
For infrastructure, Docker helps keep services consistent across environments. Kubernetes may be useful when the platform grows into several services that need scaling and orchestration.
The stack does not need to look impressive. It needs to help the product collect data, process it correctly, run models where needed, show results quickly, and stay maintainable after launch.
4. Data Pipeline and Architecture
Once the use case and interface are clear, the team has to build the part users almost never see: the data pipeline.
This is where the platform starts becoming real. Data has to move from source systems into a place where it can be cleaned, checked, transformed, stored, and used by dashboards or models. In some products, this is a simple scheduled process. In others, especially when real-time analytics is involved, the pipeline has to process events continuously.
ETL and ELT processes are usually part of this stage. With ETL, data is extracted, transformed, and then loaded into storage. With ELT, raw data is loaded first and transformed later, often inside a warehouse or analytics environment.
This stage also includes decisions about storage, processing, permissions, logging, and monitoring. A platform may work well during testing with a small dataset and then become painfully slow once real product data arrives. That is why architecture should be designed with growth in mind, but without adding unnecessary complexity too early.
The goal is simple: data should arrive in the right place, in the right format, with enough reliability that people can trust what they see on the screen.
5. Machine Learning Integration
Machine learning integration is where the model stops being a notebook experiment and becomes part of the product.
At this stage, the team trains models on prepared data, checks whether the results are useful, and decides how those models will work inside the platform. Some models may run on a schedule: for example, updating churn scores every night. Others may need to respond closer to real time, such as anomaly detection in transaction monitoring.
The important part is not just training the model. It is integrating the output into an actual analytics workflow. A prediction should appear where it helps someone make a decision. A risk score should lead to a review. A recommendation should be connected to the next action. An anomaly should come with enough context to understand whether it is serious.
This is also where teams decide how the model will be updated. Data changes. User behavior changes. Business rules change. A model that worked well during launch may become weaker later if nobody monitors it. For AI analytics platforms, maintenance is part of the product, not something to think about after everything is live.
6. Testing and Validation
Testing an AI analytics platform is not only about checking whether buttons work.
The team has to validate the data itself. Are events tracked correctly? Are fields mapped properly? Are reports using the right definitions? Does the dashboard show the same number that appears in the source system? If revenue, churn, active users, or transaction volume are calculated incorrectly, the platform can create more confusion than it removes.
Model performance also needs careful testing. A prediction may look good in development but fail when it meets new data. An anomaly detector may catch real problems but also produce too many false alerts. A recommendation system may be technically accurate but not useful for the person using it.
This stage should include both technical checks and business review. Engineers can test data flows, APIs, performance, and edge cases. Product and domain experts should check whether the output makes sense in real life. If the system flags an account as high risk, someone who understands the business should be able to say whether that warning is useful or absurd.
Good validation saves teams from a common problem: launching an analytics product that looks finished but quietly gives people numbers they do not trust.
7. Deployment and Scaling
Deployment is the point where the system finally meets real users, real data, and real workload.
The first release may include a focused set of dashboards, models, integrations, and alerts. That is usually better than trying to launch every possible feature at once. Once users start working with the platform, the team can see which metrics they actually use, which alerts they ignore, which dashboards need more detail, and where performance starts to suffer.
Scaling depends on how the product grows. Real-time pipelines may need better monitoring. Infrastructure may need to handle larger workloads without slowing the interface down.
This is also where ongoing support becomes important. Analytics platforms change with the business. New metrics appear, old reports become irrelevant, integrations break, data formats change, and models need review. Reliable support services help keep the platform useful after launch instead of letting it become another internal system nobody wants to maintain.
A good deployment plan should leave room for this. The platform does not have to be perfect on day one. It has to be stable enough to use, clear enough to trust, and flexible enough to grow with the decisions it supports.
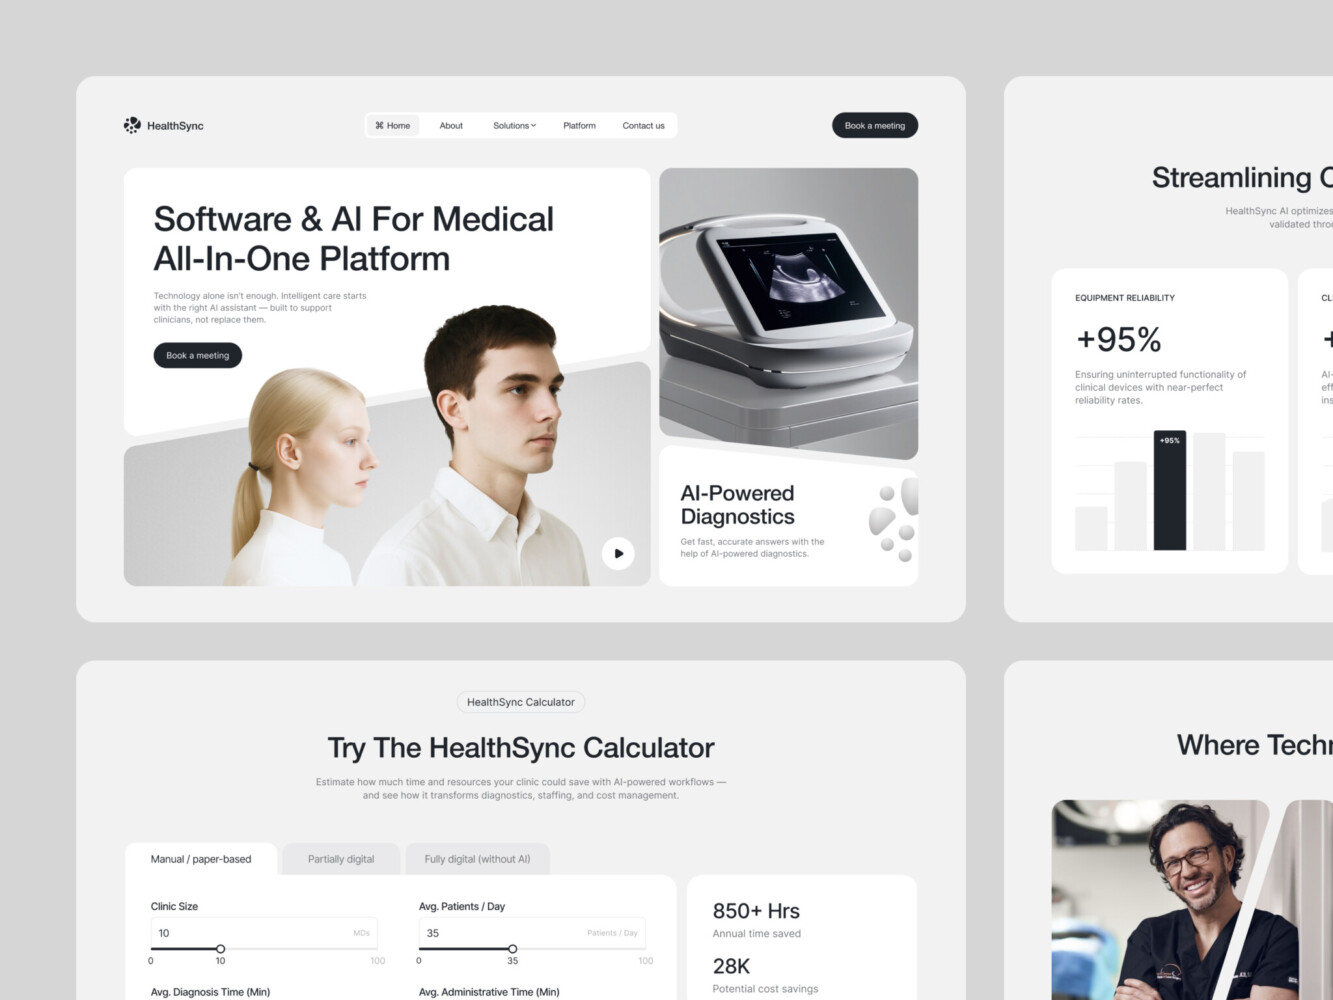
AI-Driven Medtech Website Design by Shakuro
Cost of AI Analytics Platform Development
There is no useful fixed price for an AI analytics platform, because the expensive part is not always the visible interface. A clean dashboard may look simple, but behind it there can be weeks of work on data sources, access rules, model logic, performance, and integrations.
A small first version may only need to answer a few questions: what is happening in the product, which metrics are changing, and where the team should look closer. If the data is already structured, an MVP analytics dashboard can include several core views, filters, basic roles, and one simple predictive feature. For example, the first version might show customer activity, revenue movement, churn risk, or product usage trends without trying to automate every decision from day one.
The cost grows when the data is harder to work with. One clean database is one thing. Several years of product events, payment records, CRM data, support tickets, marketing attribution, and external API data are another. The team has to decide what to import, what to clean, what to ignore, how to match records, and how to keep everything updated. In many data analytics platform development projects, this work takes more time than the dashboard itself.
Machine learning also changes the scope. A basic forecast or anomaly detector is relatively contained if the goal is clear and the data is usable. A system with several models is more complex. It may need churn prediction, demand forecasting, recommendations, risk scoring, and anomaly detection for different user groups or business units. Each model has to be trained, tested, explained in the interface, and checked after launch, because user behavior and business conditions change.
Real-time requirements are another cost driver. If a report can update once a day, the architecture can stay simpler. If the platform needs to process events as they happen, show live dashboards, or send alerts within seconds, the system needs stronger pipelines, better monitoring, and more careful testing. This is usually relevant for fintech, trading, logistics, marketplaces, and products where a late signal loses value quickly.
Integrations can also make the project larger than it first appears. A platform may need to connect with CRMs, billing tools, payment providers, product databases, support systems, internal admin panels, or third-party services. Each connection has its own formats, limits, permissions, and small surprises. That is why AI analytics software development should always include time for integration work, not just model development and dashboard design.
A reasonable MVP usually focuses on a narrow problem. It connects the most important data sources, gives users a few dashboards they will actually use, and adds AI only where it helps with a real decision. This version is useful for testing whether the platform brings value before building a larger system.
An enterprise AI analytics system is built at a different scale. It may include multiple data pipelines, role-based dashboards, real-time processing, several machine learning models, automated reports, alerts, audit logic, infrastructure scaling, and ongoing support. In this case, analytics is no longer just a reporting tool. It becomes part of how the company manages revenue, risk, operations, or customer behavior.
So the budget should be estimated after discovery, not guessed from a feature list. First, the team needs to see the data, understand the use case, check the integrations, define the models, and decide how fast the system needs to work. Only then does the estimate start to mean something.
Common Challenges in AI Analytics Development
AI analytics sounds neat until the system has to work with real company data. That is where most of the trouble starts.
The first problem is data quality. A company may have years of records, thousands of users, product events, payments, support tickets, CRM notes, and marketing reports, but that does not mean the data is ready for analytics. Some events were tracked differently across product versions. Some fields are empty. Some users appear under different IDs in different systems. Some metrics were never defined properly, but people have been using them in reports anyway.
If this layer is weak, everything above it becomes shaky. The dashboard may still look finished. The model may still return a score. But the team will quickly notice that the numbers do not match what they see in the business. Once that happens, trust is hard to restore.
Model accuracy brings another problem. A model can perform well in testing and still behave strangely after launch. User behavior changes. New customer segments appear. The product changes its pricing, onboarding, or feature set. The model was trained on one version of reality, and now the business has moved on.
That is why AI analytics development cannot treat machine learning as a one-time setup. Models need to be checked against real outcomes. False positives need to be reviewed. Forecasts need to be compared with actual results. If the system flags a customer as high-risk, someone should be able to tell later whether that warning was useful or just noise.
Scalability is another issue that often appears after the first version starts working. At the MVP stage, the platform may handle a few dashboards and a limited dataset without problems. Then more teams start using it. More integrations are added. Reports become heavier. Data refreshes need to happen more often. What worked fine during launch may start to feel slow or fragile.
This does not mean the first version needs enterprise-scale infrastructure from day one. It means the architecture should not paint the product into a corner. The team should understand which parts can stay simple now and which parts may need to grow later.
Integration work can be just as difficult as the analytics itself. AI platforms rarely live in isolation. They need data from CRMs, payment tools, product databases, support systems, marketing platforms, learning products, or third-party APIs. Each source has its own format, limits, permissions, and small inconsistencies. In complex analytics systems, a lot of development time goes into making these tools speak to each other without breaking every time one side changes something.
The safest approach is to keep the first version narrow. Choose one strong use case, connect the most important data sources, clean the metrics people actually use, and test the model against real business logic. A smaller platform that people trust is much more valuable than a large one that produces impressive charts nobody wants to rely on.
Our Experience in AI and Data Platform Development
Shakuro’s work in this area is mostly about products where the user should not feel the complexity behind the screen. AI can be powerful, financial data can be dense, and analytics can go several layers deep, but the person using the product still needs a simple answer: where am I, what can I do here, and what deserves my attention?
That is the part we focus on in AI systems, analytics platforms, and SaaS products. The architecture has to be scalable, of course, but the interface has to carry the product just as much. If users need too much time to understand the result, the platform starts losing value.
PrimeChat AI shows this from the AI product side. It is a mobile AI assistant built for fast everyday use: writing, communication, report generation, education, marketing, social media, and other tasks where people want a quick result, not a complicated setup process. Shakuro worked on UI/UX design, animation, mobile app experience, and AI development for the product.

Prime Chat AI Mobile Assistant by Shakuro
The main challenge was to keep the app from feeling like a pile of separate AI tools. Onboarding had to explain the value quickly. The chat screen had to stay focused. Tool categories had to be easy to scan. Settings, language controls, history, and PRO access had to feel natural instead of buried somewhere in the product.
The visual system supported the same goal. A dark interface, readable typography, custom icons, and category illustrations helped make the app feel modern without making it harder to use. For an AI product, that balance is important. Users may be working with advanced technology, but they still judge the product by how quickly they can get from a question to a useful answer.
TraderTale comes from a different angle. It is a fintech platform where trading performance becomes part of a user profile, with reputation, levels, leaderboards, alerts, and performance history. Here, the problem was not only to show data, but to make it readable, credible, and engaging enough for traders to return.
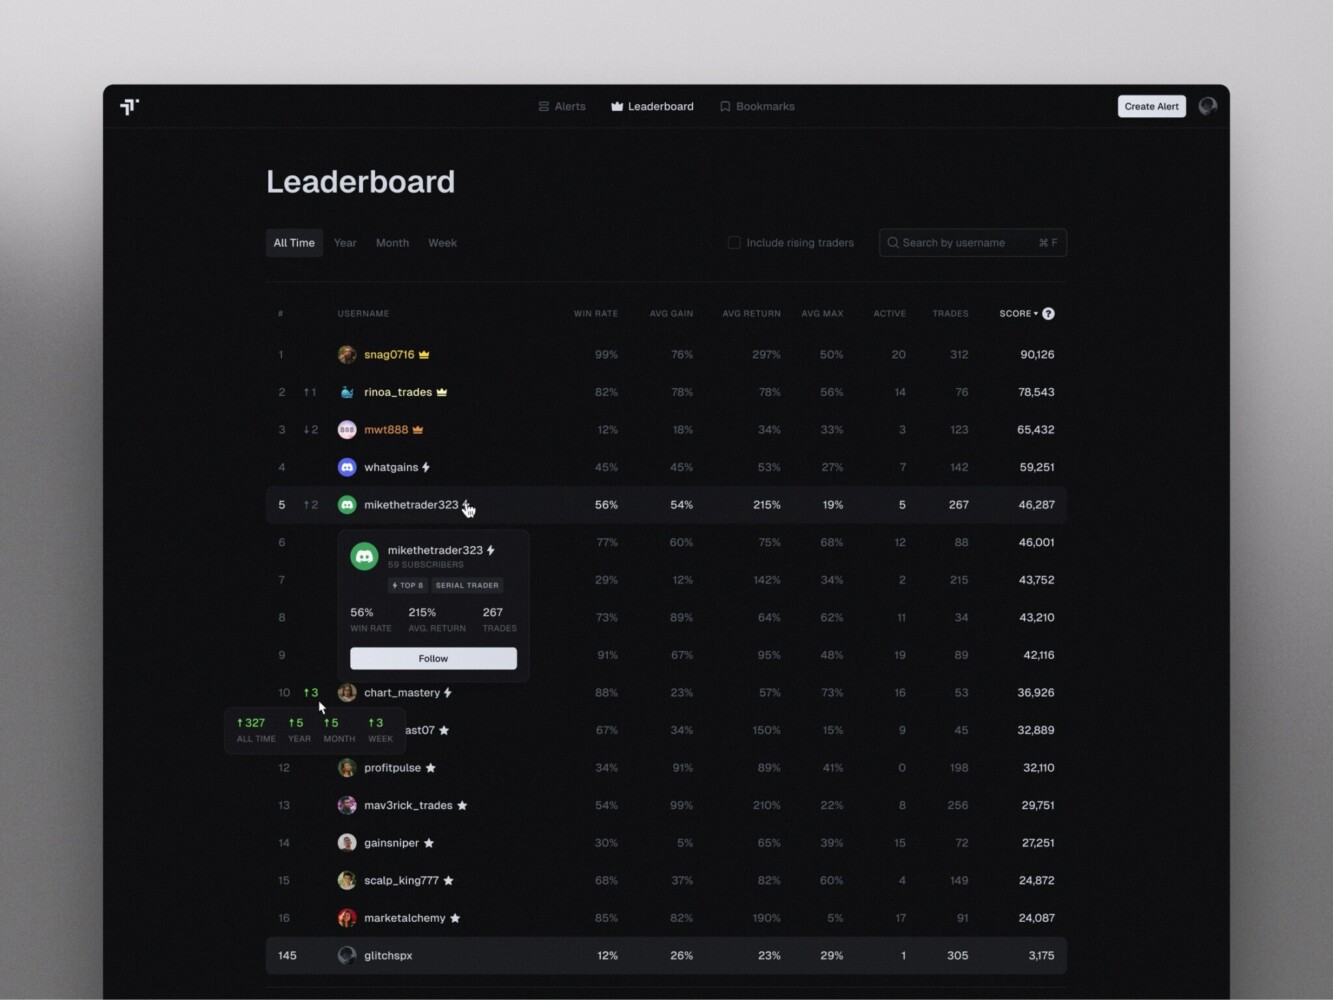
Leaderboard in TraderTale by Shakuro
Shakuro refined the product’s UI and UX around financial data and user behavior. The leaderboard was designed to show consistency, not just profit. The alerts section became a real-time feed where users can switch between detailed cards and compact tables, filter by risk, status, performance, or strategy, and open a detailed alert with chart, metrics, rationale, risk profile, and comments.
The user profile also works as part of the analytics experience. Instead of showing trading history as a plain list, it brings together portfolio highlights, advanced stats, trading style, history, and visual comparison. Raw performance data becomes something other users can browse, follow, and compare.
PrimeChat AI and TraderTale are different products, but they point to the same kind of work behind AI analytics platform development. One needed to make AI tools fast and approachable. The other needed to turn financial activity, alerts, and reputation into a clear product experience. In both cases, the real task was not to make the system look complex. It was to make complex functionality easier to use.
Why Work with an AI Analytics Development Company
AI analytics is one of those areas where a product can look simple from the outside and still be difficult to build properly.
AI dashboard development is easy to imagine. A few charts, some filters, maybe a forecast or a risk score. The harder part is everything behind it: where the data comes from, how clean it is, how often it updates, how the model uses it, what happens when the model is wrong, and whether users can understand the result without asking an analyst to explain it.
This is where working with analytics platform developers can save a lot of wrong turns. The team should know how to separate real AI use cases from features that only sound impressive. Churn prediction, anomaly detection, recommendations, forecasting, and automated reporting all need different logic. Some need machine learning. Some may work better with simpler rules at the first stage.
Scalable data architecture is another reason to bring in a specialized team. Many analytics products begin with one or two data sources and then grow quickly: more integrations, more dashboards, more roles, more models, more reports. If the first version is built too casually, the team may have to rebuild the data layer right when the product starts gaining value.
There is also a practical time-to-market benefit. A company does not always need a large enterprise platform from day one. Often, the smarter path is to define one strong use case, connect the most important data, design a clear dashboard, and launch an MVP that shows whether the idea works. A team with AI development experience can help keep that first version focused instead of turning it into a long technical experiment.
The value of an outside development partner is not that they know your business better than you do. They do not. The value is that they can turn your business logic into a system that works: data pipelines, models, dashboards, alerts, integrations, and infrastructure that can grow after the first release.
Final Thoughts
An AI data analytics platform only works when the whole chain is solid: data comes in cleanly, models answer a real business question, insights are shown in a useful format, and people can turn those insights into decisions.
If one part is weak, the platform starts losing value. A dashboard with too many charts slows people down instead of helping them. And an architecture that cannot scale will eventually turn a useful product into something fragile.
The best systems are usually built with a narrow first version and a clear reason to exist. Start with the decision the platform should improve. Find the data needed to support it. Build the model only where it adds value. Show the result in a way users can understand. Then expand once the product has proven that people actually rely on it.
For companies working with large amounts of data, this is where AI analytics becomes more than reporting. It helps teams see patterns earlier, react faster, and make decisions with fewer assumptions. If you want to build an AI data analytics platform that is clear, scalable, and useful in real work, Shakuro can help turn the idea into a product people can actually use.