Quick Facts
| Question | Answer |
| Best for | Forecasting churn, demand, revenue, risk, fraud, user behavior, and operational issues. |
| Typical timeline | 3-5 months for a focused MVP; 6-12+ months for a larger platform. |
| Core components | Data connectors, data pipeline, storage, prediction model, API layer, dashboard, alerts, monitoring. |
| Common tools | Python, SQL, TensorFlow, PyTorch, scikit-learn, AWS, Azure, GCP, Snowflake, BigQuery, Power BI, Tableau. |
| Main risk | Poor data quality, which can lead to inaccurate predictions and low user trust. |
Introduction
Most companies already have more data than they can comfortably use.
Contents:
Sales teams track leads. Product teams watch behavior. Finance teams follow revenue, risk, and market changes. Support teams collect every complaint, delay, and repeated question. The problem is rarely “we don’t have data.” The problem is that the data mostly explains what already happened.
Predictive analytics systems move the work one step forward. Instead of waiting for a monthly report, teams can estimate what is likely to happen next: which customers may churn, what demand may look like next quarter, where financial risk is rising, or which users need attention before they disappear.
That sounds neat on paper. In practice, it takes careful product work. A prediction that lives in a spreadsheet nobody opens is not useful. A dashboard full of vague scores is not much better. The system has to connect data, models, workflows, and people’s real decisions.
Key takeaways:
- Predictive analytics systems use historical and current data to estimate future outcomes.
- They create most value in recurring, costly decisions (e.g., churn prevention, financial risk management, demand and inventory planning, workforce planning) where acting earlier is worth money.
- A strong model is not enough; bad dashboards or unexplained scores destroy trust and adoption.
What Is a Predictive Analytics System?
It is software that uses historical and current data to estimate future outcomes. It can rely on statistics, machine learning, business rules, or a mix of all three.
IBM describes predictive analytics as the use of historical data, statistical modeling, data mining, and machine learning to predict future results. That is a good technical definition, but it still needs a product layer around it.
In a business setting, predictive analytics software should answer questions like:
- Which customers are most likely to leave?
- Which transactions look risky?
- How much demand should we expect next month?
- What sales opportunities need more focus?
- Which assets, machines, or systems may break down soon?
- Which users will purchase, upgrade, or need support?
It helps to separate predictive analytics from nearby categories.
What are the Three Different Types of Predictive Analytics?
Descriptive analytics tells you what happened. Diagnostic analytics helps explain why it happened. Predictive analytics estimates what may happen next. Prescriptive analytics suggests what to do about it.
Most useful systems contain a little bit of each.
Example:
A sales forecasting product may show last quarter’s results, explain which pipeline stages slowed down, predict next quarter’s revenue, and recommend which deals need action.
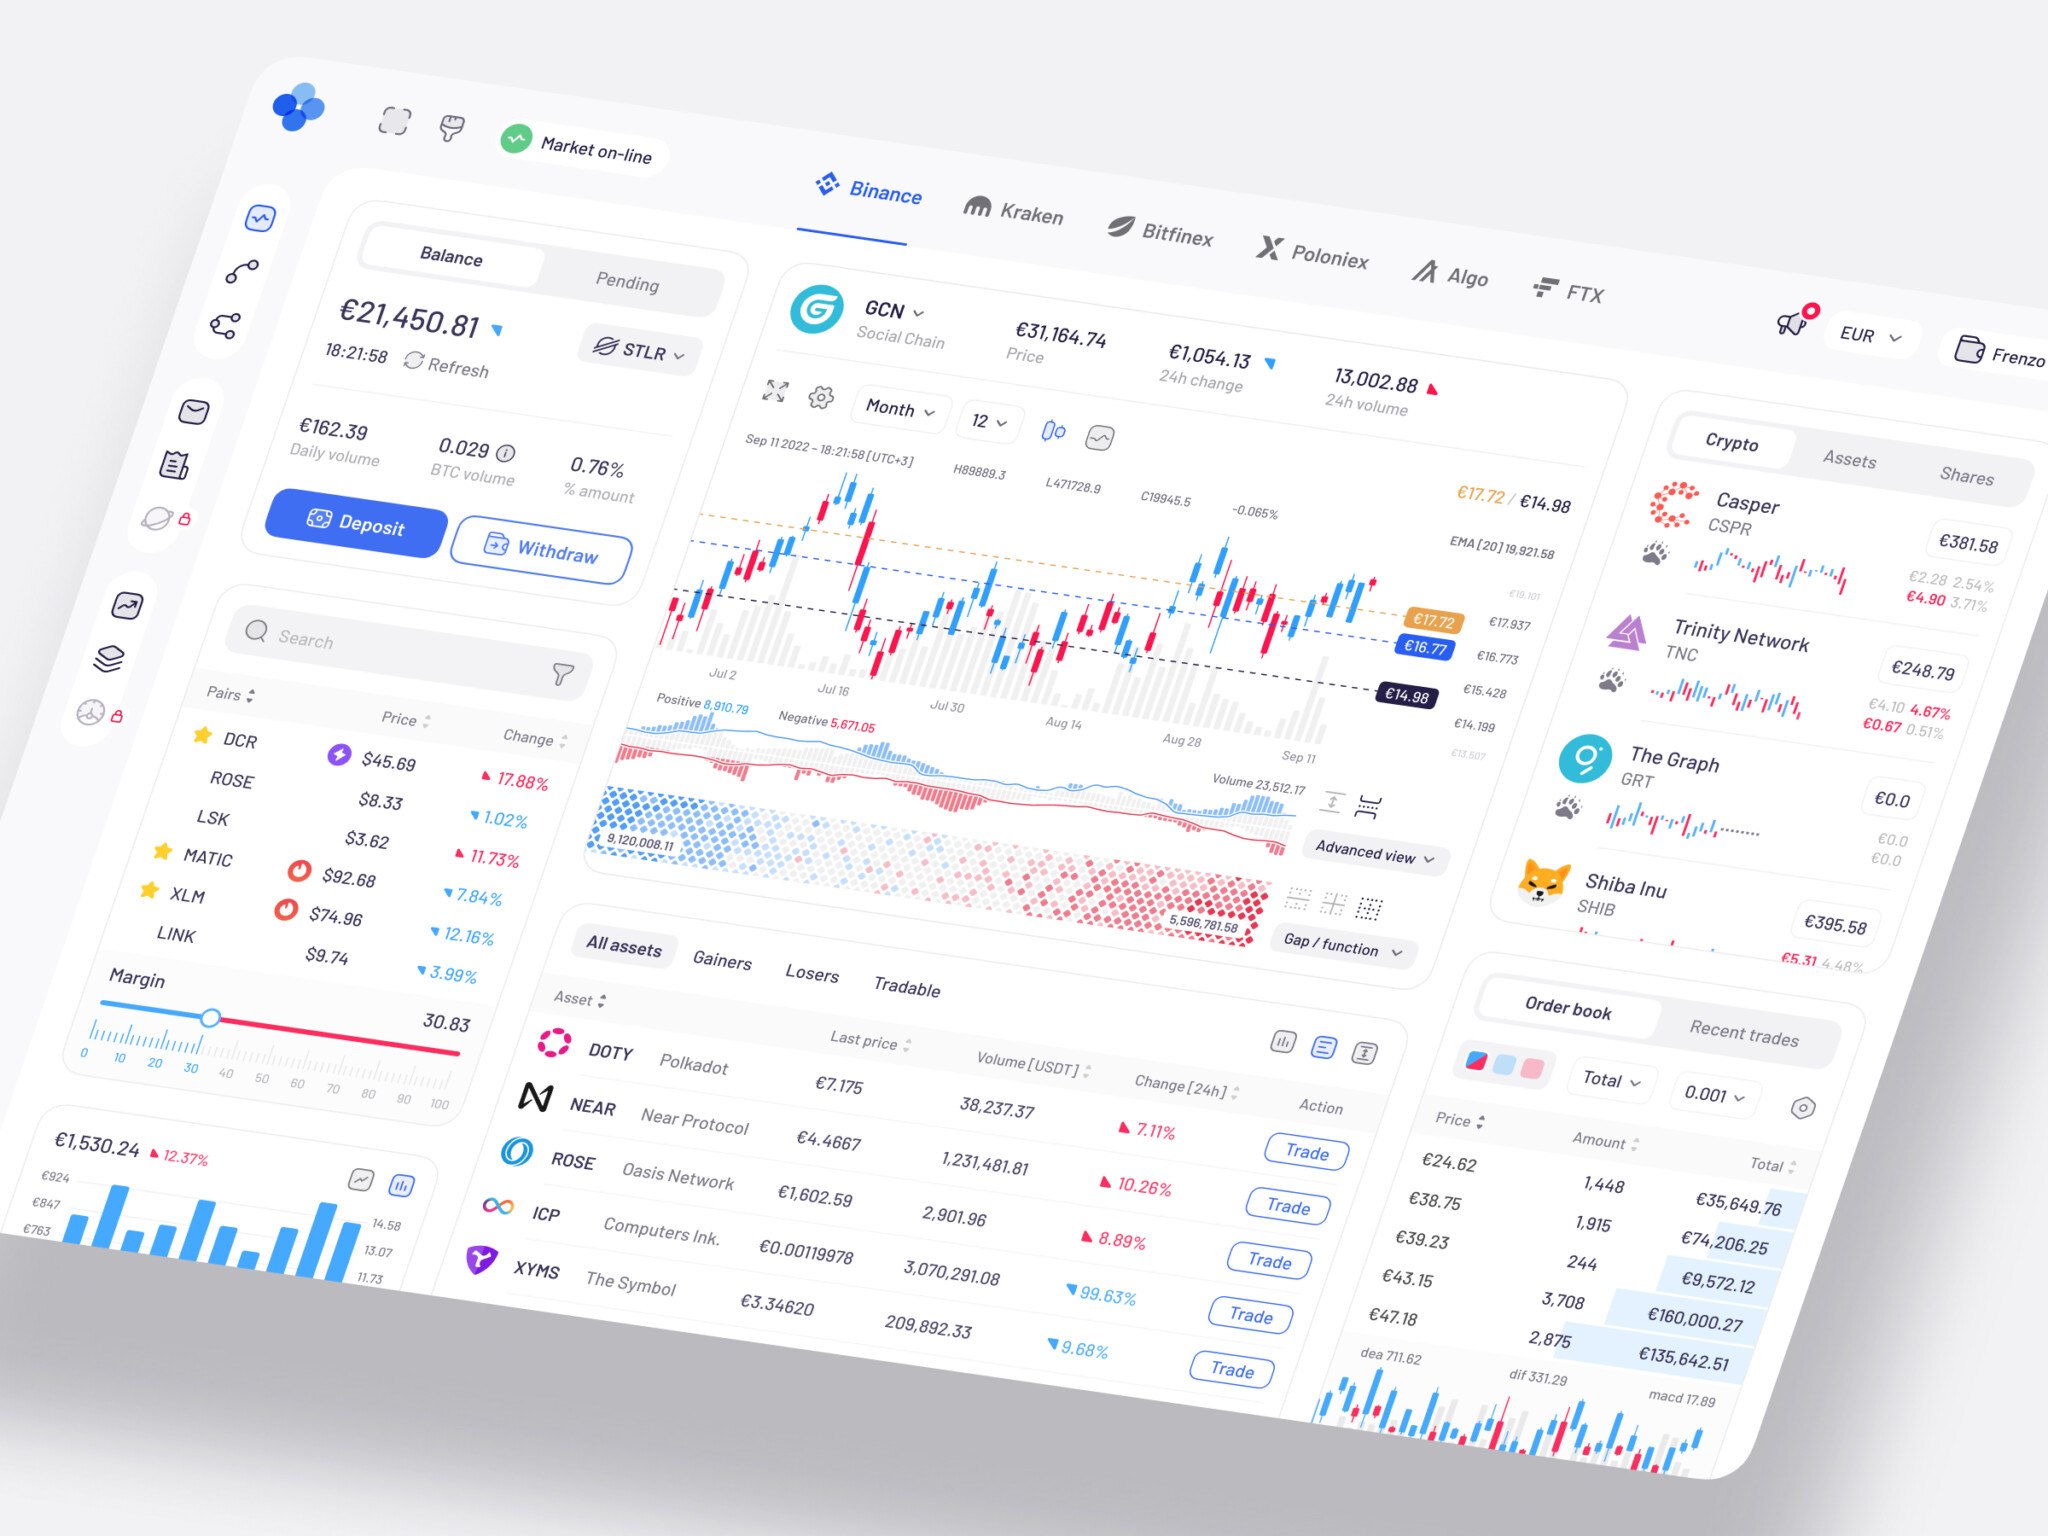
SaaS marketing dashboard by Conceptzilla
Where Predictive Analytics Creates Business Value
The best use cases are tied to decisions that happen often and cost money when handled late.
Example:
Customer churn, for instance. If a SaaS company finds out a customer is unhappy only after cancellation, the data came too late. A predictive analytics platform can watch product usage, support tickets, billing history, and engagement patterns to flag accounts that may need attention.
Financial risk is another strong case. Trading tools, lending platforms, investment products, and fraud monitoring systems all depend on reading patterns quickly. The goal is not to magically know the future. It is to make risk easier to see before it becomes expensive.
Predictive analytics in business often shows up in these areas:
- Revenue forecasting
- Demand planning
- Fraud detection
- Risk scoring
- Customer segmentation
- Churn prevention
- Inventory planning
- Predictive maintenance
- Personalized recommendations
- Workforce and capacity planning
The common thread is timing. A forecast does not need to be perfect to be useful. It needs to be early enough, clear enough, and tied to an action someone can take.
Key Features of Predictive Analytics Software
It usually needs more than a model and a chart. The product has to support the whole path from raw data to decision.
A practical system often includes:
Data connectors
The software needs to pull data from CRMs, ERPs, payment systems, product analytics tools, spreadsheets, market feeds, IoT devices, or internal databases.
Data cleaning and normalization
Messy data creates messy predictions. Duplicate records, missing fields, inconsistent naming, and old definitions can quietly damage the whole product.
Modeling layer
This is where forecasting, classification, anomaly detection, scoring, or recommendation logic lives. Some products need advanced machine learning. Others can start with simpler statistical models and business rules.
Prediction engine
The system should generate outputs users can understand: scores, probabilities, forecasts, risk levels, confidence ranges, or ranked lists.
Dashboards
A predictive analytics dashboard should not just display numbers. It should help users see what changed, why it matters, and what they can do next.
Alerts and notifications
Some predictions lose value if nobody sees them in time. Alerts can notify teams when a churn risk rises, a transaction looks suspicious, or a forecast crosses a threshold.
Role-based access
Executives, analysts, managers, and operators do not need the same view. Permissions matter, especially in fintech, healthcare, insurance, and enterprise tools.
Audit logs and explainability
If a system influences financial, operational, or customer decisions, users need to know where predictions came from and when they changed.
Integrations with workflows
The strongest products fit into existing work. A churn prediction can create a CRM task. A fraud signal can trigger manual review. A demand forecast can update planning tools.
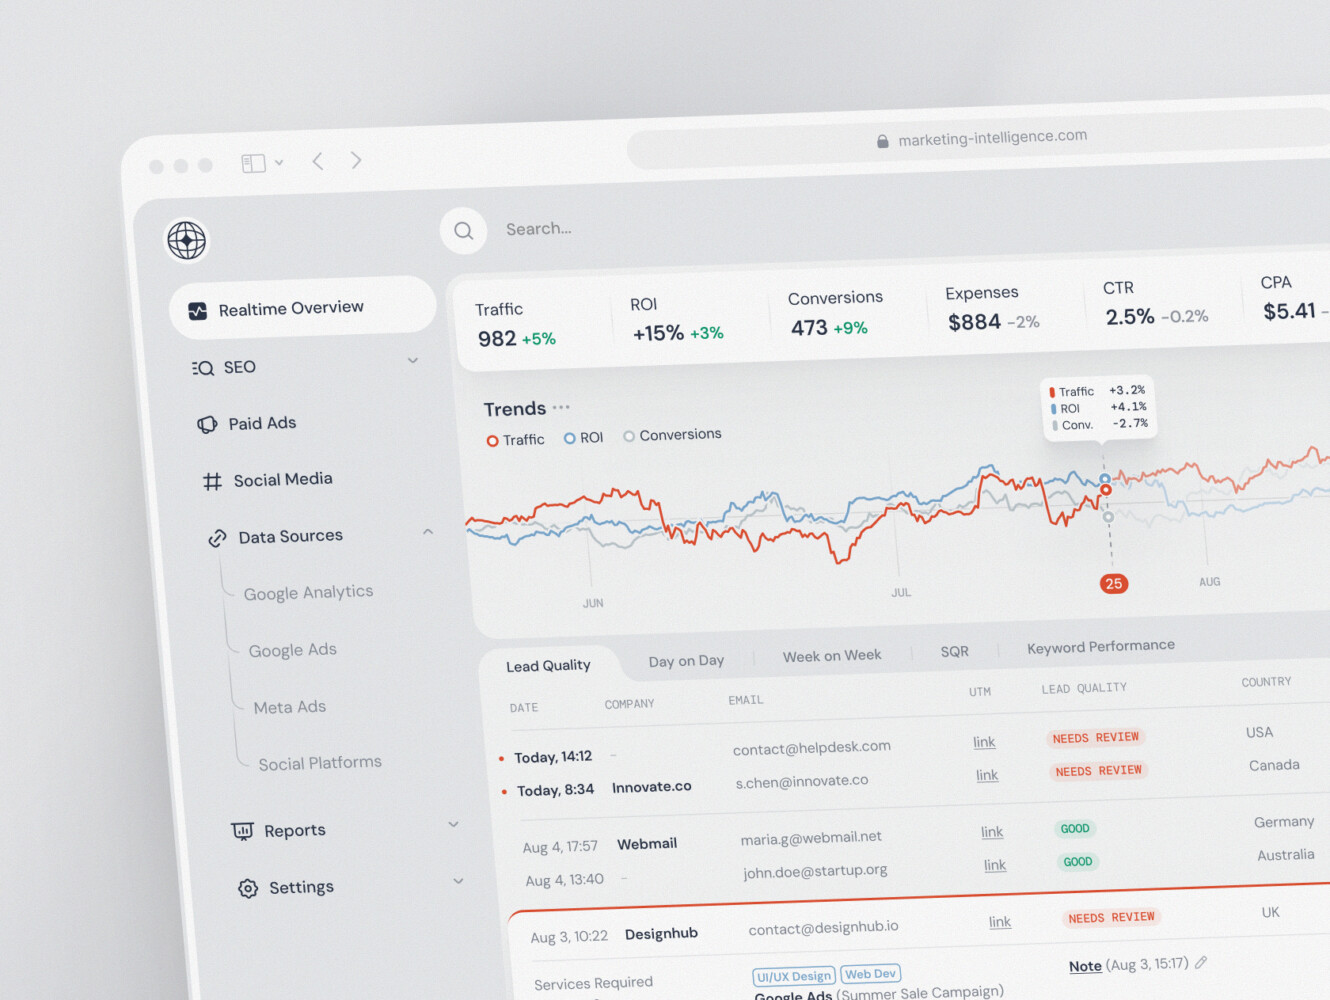
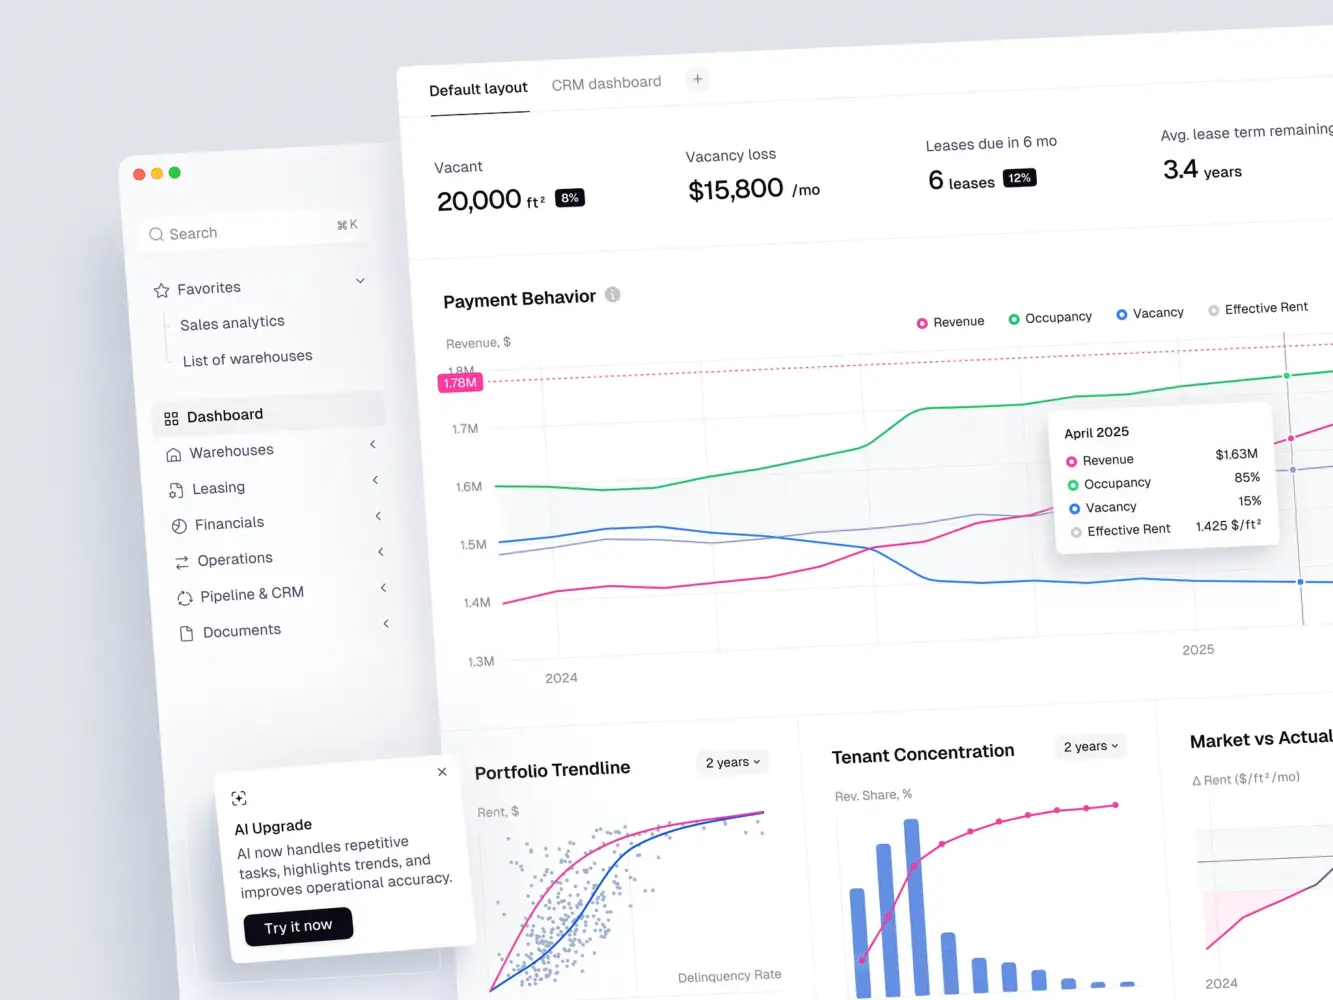
Financial Market Trading Analytics Tool Dashboard Design by Shakuro
Predictive Analytics System Architecture
The architecture depends on the product, but most systems share a familiar shape.
First, data enters from different sources. That might be product events, customer records, transactions, sales history, support conversations, financial feeds, or operational logs.
Then the system processes the data. It cleans fields, matches records, removes duplicates, handles missing values, and transforms raw inputs into features the model can use.
Storage comes next. Depending on scale, the product could be using a data warehouse, lakehouse, relational database, feature store, or a combination of these. A simpler setup may be sufficient for smaller MVPs. For enterprise tools, data architecture is one of the main cost drivers.
The model layer is responsible for prediction. This could be time-series forecasting, regression, classification, clustering, anomaly detection, or recommendation models. The system also needs a strategy for retraining models as data changes.
An API layer connects the predictions to the interface and other systems. Business rules often live here. For example, the model might predict the probability of churn, but the business logic decides when to show a warning or trigger an alert.
Finally, the frontend turns all of this into something people can use. Tables, charts, filters, risk levels, scenario tools, and reports should be designed around decisions, not around showing off every data point.
Security and monitoring sit across the whole architecture. Predictive analytics systems often handle sensitive business or personal data, so access control, encryption, logging, and compliance planning cannot be added as an afterthought.
Why Dashboard Design Matters More Than People Expect
A weak dashboard can make a good model feel useless.
This happens when predictions are shown without context. A user sees “Customer risk: 78” and has no idea what to do with it. Is that high? Why did it change? Which behavior caused the score? Should someone call the customer, offer a discount, escalate a ticket, or ignore it?
Good predictive analytics dashboard design answers four questions:
- What is likely to happen?
- How confident is the system?
- Why is this prediction being shown?
- What action should the user consider?
The interface should also make uncertainty visible. Forecasts are not facts. They are estimates. Ranges, confidence levels, trend lines, and explanations help users trust the product without treating it as magic.
This is where UX work becomes part of the analytics system, not decoration. For complex tools, especially in fintech or operations, clarity is a feature.
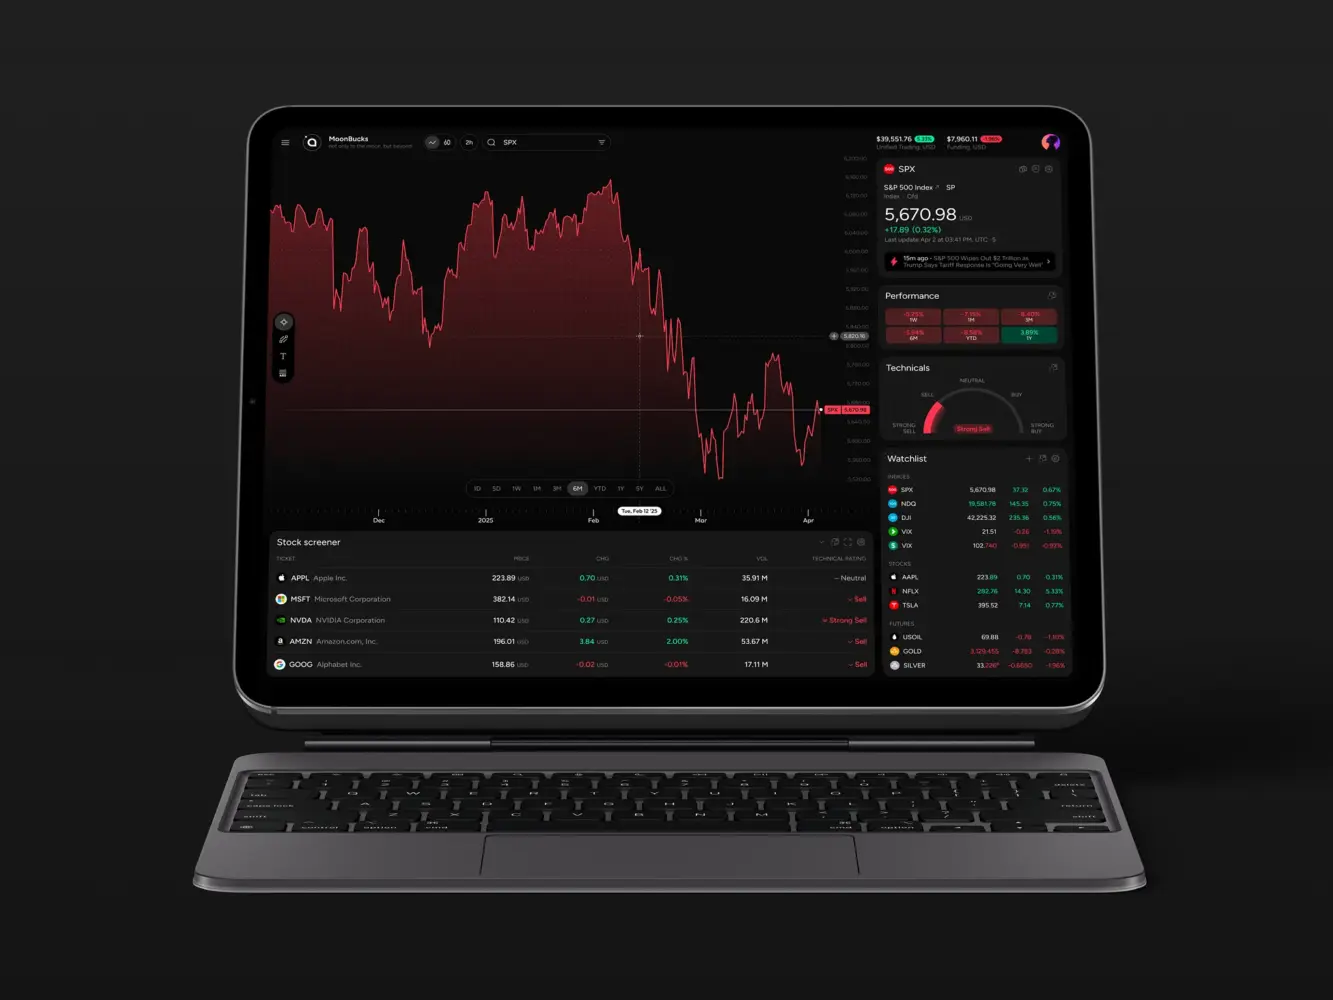
Marketing analytics dashboard by Shakuro
How to Build a Predictive Analytics System
A sensible development process starts with the decision, not the model.
1. Define the Business Question
“Use AI for analytics” is too broad. “Predict which customers are likely to churn in the next 30 days” is much better. The sharper the question, the easier it is to define data, model logic, dashboard views, and success metrics.
2. Audit the Data
Before building anything serious, check what data exists, where it lives, how clean it is, and whether it can legally be used for the intended purpose. Many predictive projects slow down here, and that is normal.
3. Design the Workflow
Who uses the prediction? How often? What do they do after seeing it? What happens if the prediction is wrong? These questions shape the product.
4. Choose the Technical Approach
You don’t need complex ML from day one for every product. Some MVPs can be initiated with rules, scoring models, or less sophisticated forecasting methods. The system can evolve into more sophisticated forms as the team receives feedback and enhances the data foundation.
5. Construct the MVP
A good MVP should focus on one valuable use case. It should have data ingestion, a working prediction flow, a usable dashboard, and enough monitoring to assess accuracy.
6. Test with Real Users
Accuracy matters, but adoption matters too. If users do not understand or trust the output, the system will sit unused.
7. Deploy, Monitor, and Improve
Models drift. Markets change. Customer behavior changes. A predictive analytics application needs ongoing monitoring, retraining, and product refinement.
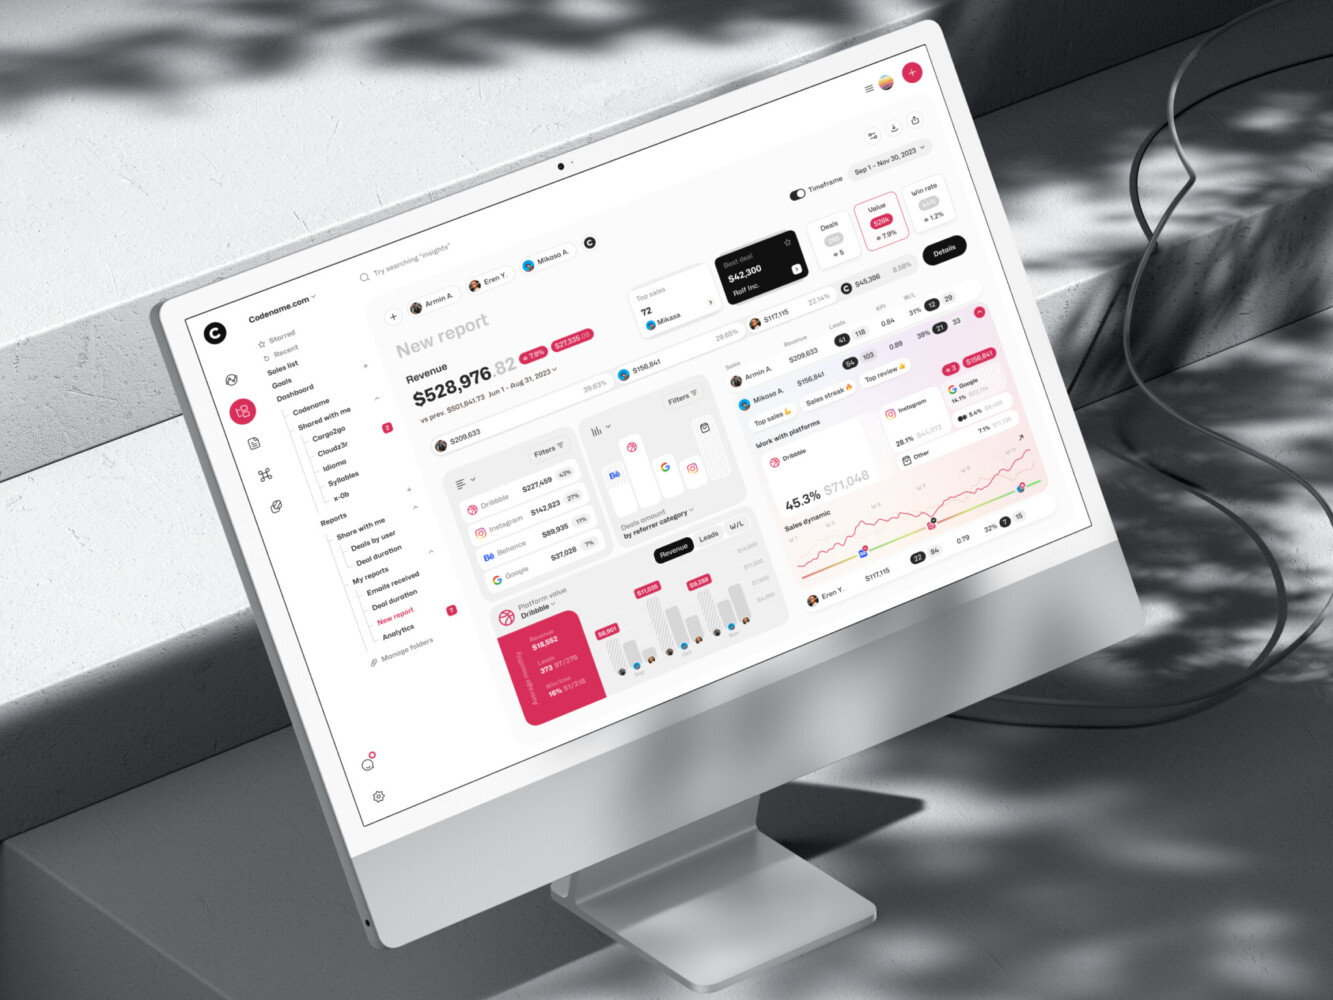
ERP Dashboard Design for Warehouse Portfolio Management by Shakuro
Common Development Challenges
Data quality is the first big challenge. Predictive systems are sensitive to missing fields, old records, inconsistent labels, and biased samples. If the source data is unreliable, the output will be unreliable too.
The second challenge is explainability. If users can’t understand a prediction, they will reject it. This is especially true in finance, healthcare, insurance, logistics, and enterprise operations.
Another issue is model drift. A model trained on last year’s behavior may not be as accurate when pricing changes, user segments change or external conditions change.
Integrations can also take more effort than expected. Pulling data from ten different tools, each with its own structure and permissions, is rarely a small task.
Then there is the product challenge: too much information. Many analytics products fail by showing everything. A useful system filters noise, highlights what matters, and gives users a path to action.
How Much Does Predictive Analytics Software Cost?
The cost depends on scope, data complexity, integrations, and model depth.
A focused MVP may cost around $40,000 to $90,000. This usually covers one use case, limited integrations, basic data processing, a prediction model, and a dashboard.
A mid-level product may land between $90,000 and $250,000. This range fits products with multiple data sources, custom dashboards, user roles, alerts, better monitoring, and more advanced modeling.
Enterprise systems often start around $250,000+. These may involve complex infrastructure, strict compliance requirements, large data pipelines, advanced ML, audit trails, multiple user groups, and long-term support.
The largest cost drivers are usually:
- Data preparation
- Number of integrations
- Model complexity
- Dashboard depth
- Security and compliance
- Performance requirements
- Ongoing monitoring and retraining
A cheaper first version can be a smart move if the business case is still being tested. The trick is to avoid building a throwaway prototype. Even an MVP should have a technical path toward a larger system.
| Product Scope | Estimated Cost | Best For | What’s Usually Included | Main Cost Drivers |
| MVP | $40,000-$90,000 | Testing one predictive use case | 1-2 data sources, basic data cleaning, simple prediction model, core dashboard, limited user roles | Data readiness, first integration, dashboard complexity |
| Mid-Level Platform | $90,000-$250,000 | Growing products with several teams or workflows | Multiple integrations, custom models, alerts, role-based dashboards, reporting, monitoring, admin panel | Number of integrations, model complexity, UX depth, infrastructure |
| Enterprise System | $250,000+ | Regulated, high-scale, or multi-department systems | Advanced ML, large data pipelines, audit logs, compliance features, multi-role access, model monitoring, retraining workflows | Compliance, security, data volume, performance, long-term maintenance |
Our Experience in Creating Predictive Analytics Tools
These solutions often overlap with fintech, investment tools, trading interfaces, dashboards, and AI-assisted decision products. We have been helping turn raw data into glanceable and reliable charts for more than 19 years.
During predictive analytics system development, there is close collaboration between frontend and backend, with strict peer-to-peer code reviews. We also pay attention to UX/UI design because like I said—if people don’t understand the output, they will not agree with the prediction.
Our team uses AI like ChatGPT and Meta AI to build predictive solutions. This provides better decision-making and automates routine tasks.
There are several real-life cases that serve as proof of these words.
Symbolik is a trading analysis platform built for serious investment workflows. It offers predictive analytics to make critical financial decisions fast, often under pressure. While working on Symbolik with the DeMark team, we dealt with complex data and high user expectations. Custom charts, dashboards, feeds—we’ve built it all. And it all helps people manage their resources more efficiently. For predictive analytics solutions, this kind of work matters because the system has to handle both data and user behavior at scale.
TraderTale focuses on trading performance, risk profiles, leaderboards, alerts, and portfolio statistics. It has analytics-heavy UX. Users do not just need charts. They need ranking, comparison, filters, signals, and a way to understand performance over time. We delivered these essentials, as well as personalization and gamification. They kept users engaged in the workflow.
The useful lesson is that analytics products live at the intersection of data, interface design, system architecture, and decision-making. If one part is weak, the product feels weak.
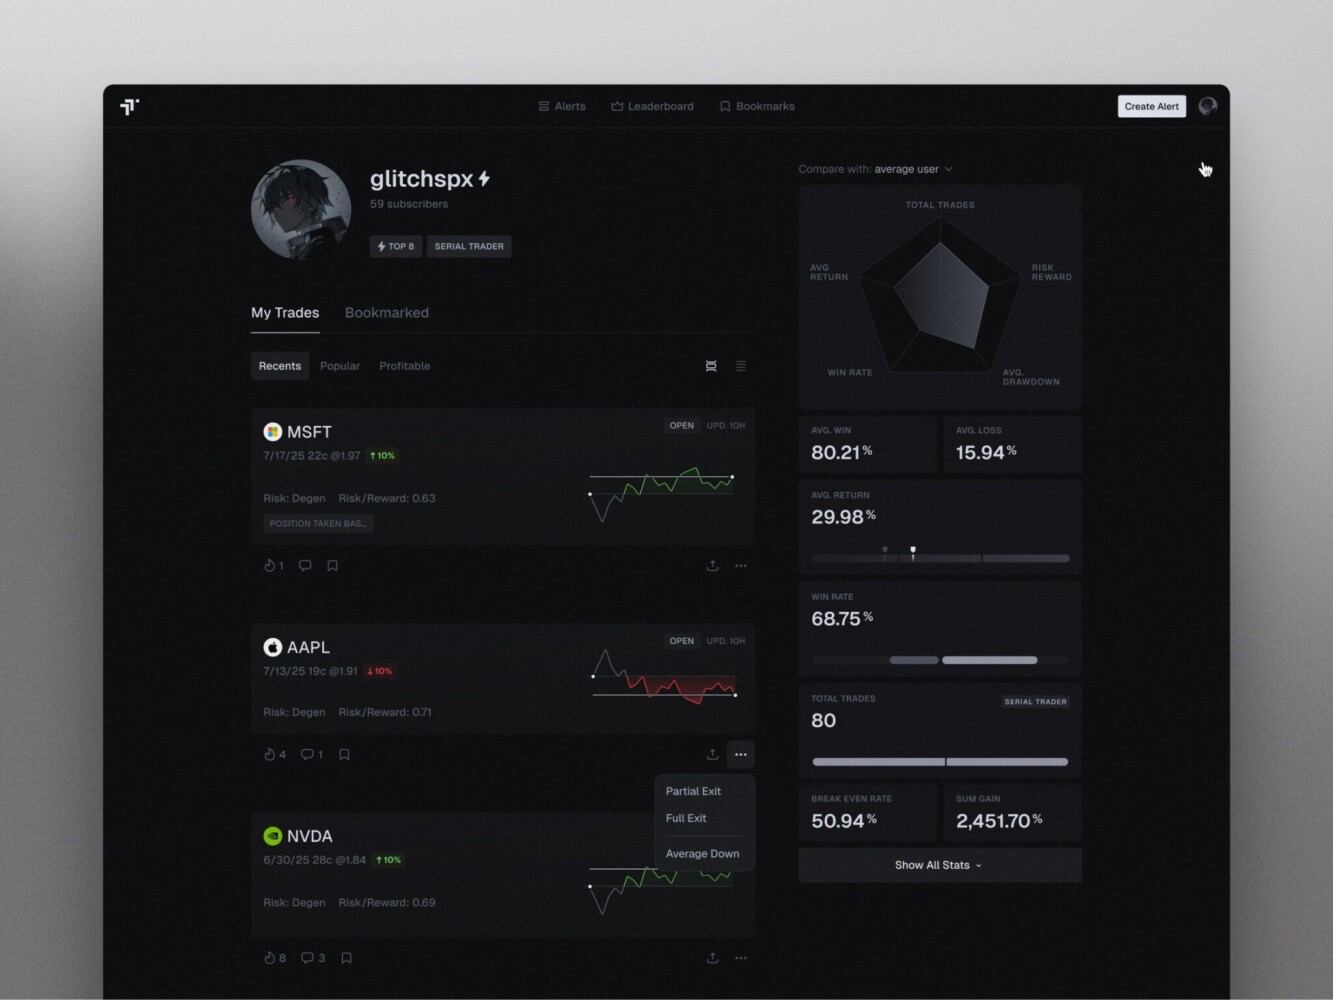
TraderTale: Social Platform for Traders by Shakuro
Why Work With a Development Company on Predictive Analytics Systems?
A predictive analytics project is easy to underestimate.
At first glance, it may look like a model plus a dashboard. In reality, the work touches backend development, data engineering, frontend design, security, integrations, UX research, cloud infrastructure, and long-term maintenance.
A development team can help shape the product before too much money goes into the wrong version. That includes choosing the right MVP scope, checking whether the available data supports the idea, designing dashboards around user decisions, and building an architecture that can grow.
This matters most when the product will be used by real teams, customers, analysts, or managers every day. Internal experiments can be rough. Production software cannot stay rough for long.
Final Thoughts
Predictive analytics software is not valuable because it sounds advanced. It is valuable when it helps people act earlier and with more confidence.
The model is only one part of that. The data has to be clean enough. The architecture has to support the workflow. The dashboard has to explain the prediction. The user has to trust what they see. And the business has to know what action comes next.
Start with one decision worth improving. Build around that. Then let the system grow as the data, users, and business case become clearer.
Need an estimate for a predictive analytics product? Shakuro can help shape the strategy, UX, architecture, and development path from MVP to a more mature analytics platform.
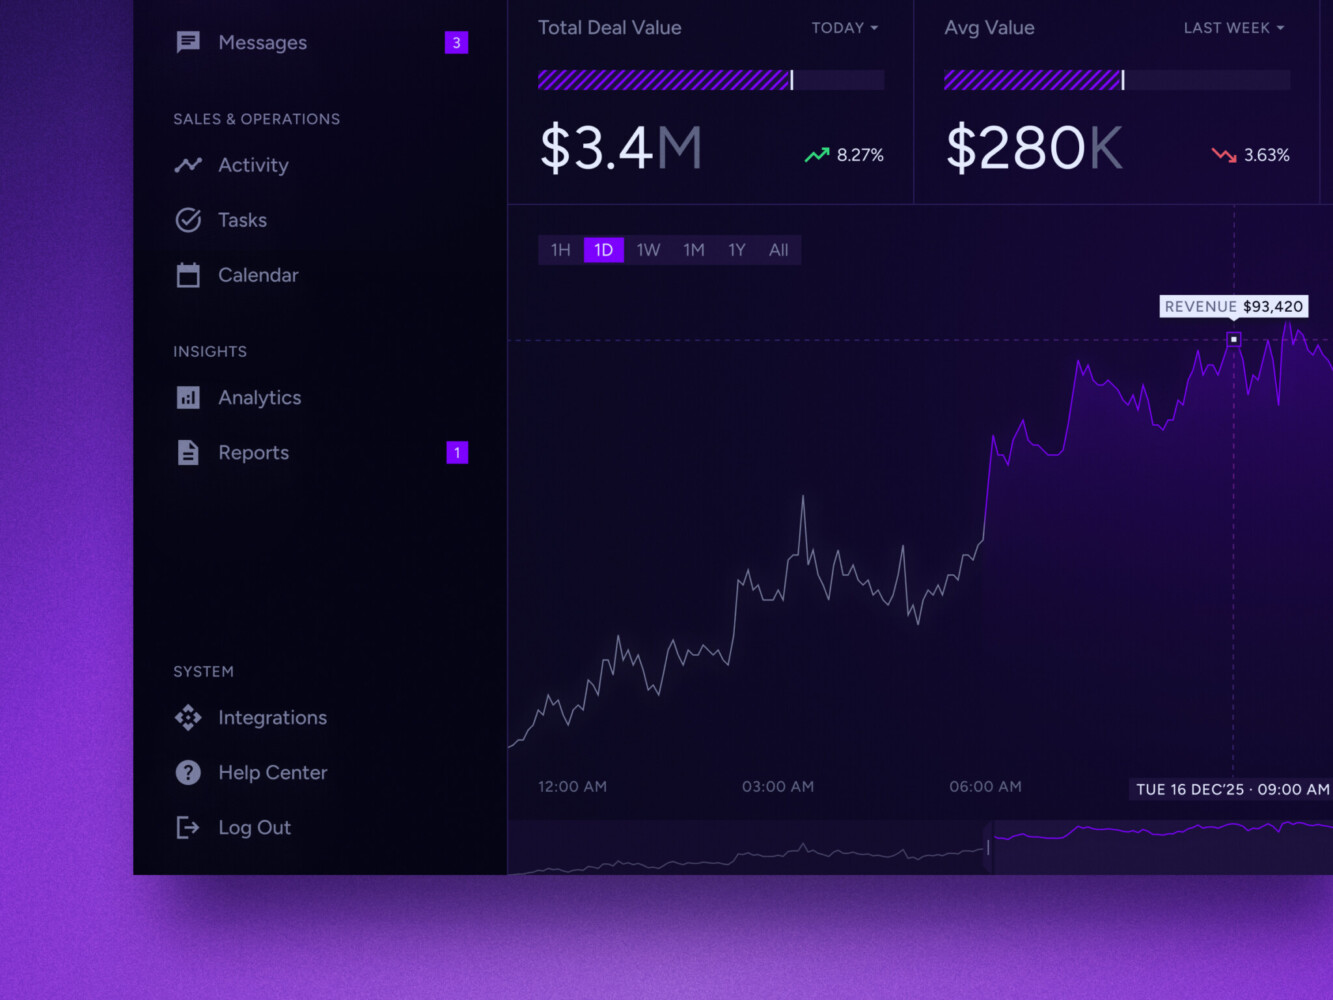
Real-time data dashboard by Shakuro
FAQ
What is a Predictive Analytics System?
It is software that uses historical and current data to estimate future outcomes. It may predict churn, revenue, demand, financial risk, fraud, maintenance needs, or user behavior.
How is Predictive Analytics Different from Business Intelligence?
Business intelligence usually explains what already happened. Predictive analytics estimates what is likely to happen next. Many products combine both.
What Data is Needed for Predictive Analytics Software?
It depends on the use case. A churn system might need product usage, billing history, support tickets, and customer profiles. A financial risk system might need transactions, market data, user behavior, and account history.
How Long Does it Take to Build a Predictive Analytics MVP?
Usually, it takes 3 to 5 months to build a focused MVP, but it depends on the readiness of your data, the number of integrations you need, the complexity of the model, and the size of the dashboard you want to build.
Can Predictive Analytics be Added to an Existing SaaS Product?
Yes. Many teams add predictive features to existing products: churn scores, demand forecasts, risk alerts, recommendations, or revenue predictions. The main question is whether the existing product collects enough useful data.
How do you Measure Predictive Analytics Accuracy?
Typical metrics are precision, recall, MAE, RMSE, AUC, and business-level metrics like reduced churn, improved forecast accuracy, fewer false positives, and faster decision-making.