
For those who prefer to listen rather than read, this article is also available as a podcast on Spotify.
Contents:
Most eLearning teams think they have a content problem, a UX problem, or a retention problem. Very often, they actually have a data problem.
When learners drop off halfway through a course, skip assignments, ignore quizzes, or never return after signing up, the platform is already telling you what is wrong. The issue is that without the right analytics system, those signals stay buried inside raw events, fragmented dashboards, and disconnected reports. What looks like weak engagement on the surface is often a product team flying blind.
That is why data analytics for eLearning platforms has become a core part of modern EdTech development. Companies invest in learning analytics not just to collect numbers, but to understand how people learn, where they struggle, what keeps them engaged, and which changes actually improve outcomes. In a competitive market, that kind of visibility is no longer a nice extra. It directly affects retention, course completion, product decisions, and long-term growth.
Building this kind of system takes more than adding charts to an admin panel. A useful analytics layer has to capture the right learner actions, structure data in a way that makes sense, and turn it into insights that product, content, and business teams can use. That is why companies with strong eLearning expertise usually approach analytics as part of the platform architecture itself. And because these products need scalable logic, reliable reporting, and room for continuous improvement, they often benefit from the same product thinking found in mature teams with deep SaaS expertise.
In this guide, we will look at how analytics works in eLearning platforms, which features matter most, how these systems are built, which technologies support them, and what challenges teams face when turning educational data into a real product advantage. We will also look at how analytics supports the rise of AI-driven learning platforms and why clean, well-structured data is becoming one of the most important assets in EdTech.
What Is Data Analytics in eLearning?
When people talk about education data analytics, they usually mean one simple thing: understanding what is really going on inside the platform.
Not what the course team planned. Not what the funnel was supposed to look like. What learners actually do.
They sign up and disappear after the second lesson. They replay one video several times. They pass tests quickly but never finish the course. They spend a lot of time in one module and almost none in another. All of this leaves traces. Analytics helps collect those traces and make sense of them.
That is the role of education data analytics in eLearning systems. It helps teams track how people use the platform, how they move through the learning path, and where the process starts falling apart. In the end, this is not about numbers for the sake of numbers. It is about improving educational outcomes with something more reliable than guesswork.
Usually, these systems look at three things at once.
The first is user behavior. This is the raw activity inside the product: logins, clicks, session length, video plays, navigation between lessons, downloads, pauses, repeats, exits. Behavior data shows how learners interact with the platform as a product.
The second is learning progress. Here the focus is narrower: completed modules, quiz attempts, assessment scores, time spent on lessons, progression speed, course completion. This is the part that shows whether users are actually moving through the material or just touching it.
The third is engagement metrics. These help teams understand how involved learners stay over time. Do they come back after the first session? Do they keep going after the first week? At what point do they start dropping off? This is often where product issues become visible first.
In practice, learning analytics usually falls into three types.
- Descriptive analytics shows what already happened. It gives the basic picture: how many learners enrolled, how many finished, where people spent the most time, where they dropped out, which quizzes had the lowest scores. This is the starting point for almost every analytics system.
- Diagnostic analytics tries to explain the reason behind those numbers. If users keep leaving after the same lesson, there is usually a cause. The material may be too dense. The structure may be unclear. The assignment may come too early. This type of analytics is useful because it helps teams find the weak point, not just notice the result.
- Predictive analytics looks ahead. It uses existing patterns to estimate what may happen next. For example, it can help identify learners who are likely to lose interest, fall behind, or leave before completion. This is also the layer that matters in predictive learning systems, where the platform starts responding to learner data instead of only reporting it.
Underneath, the setup is usually quite practical.
Data pipelines collect events from the platform and move them into the system. A data warehouse stores that information in a structured form. The analytics engine processes it and turns raw activity into usable metrics and patterns.
So, in plain terms, data analytics in eLearning is what helps an EdTech product see its learners clearly. Without it, teams are mostly reacting on instinct. With it, they can spot problems earlier, understand what needs fixing, and make better product decisions.
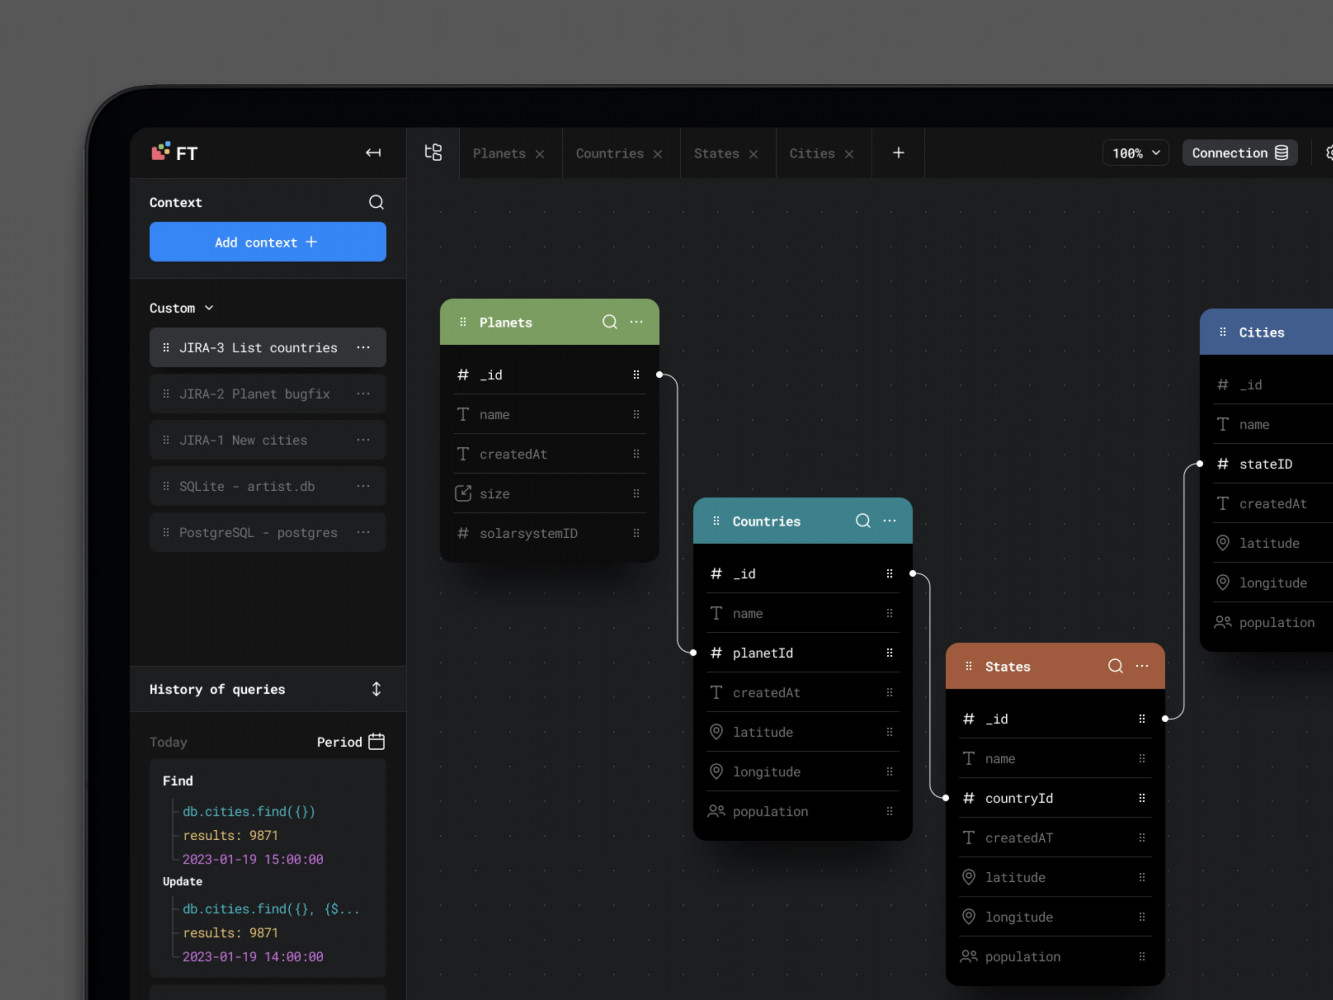
Database Visualisation Web Design by Conceptzilla
Key Features of eLearning Analytics Platforms
A lot of analytics features sound useful in theory. In reality, only some of them help teams understand what is happening in the product and what needs attention.
In eLearning, the most important features are usually the simplest ones. You need to see how people move through the course, how long they stay, what they interact with, how they perform, and where the learning process starts slipping. If the platform cannot show that clearly, the rest of the analytics layer becomes much less useful.
User Behavior Tracking
This is the part that shows how learners actually use the platform.
Not how the course was intended to work, but how people behave once they get inside it. Some move steadily from lesson to lesson. Some open a course, spend ten minutes there, and never come back. Some watch every video but ignore tests. Some get stuck in one section and keep circling around it. Behavior tracking makes those patterns visible.
Course progress is one of the first things teams look at. It shows where learners begin, how far they get, and where many of them stop. That sounds basic, but it is often enough to reveal that the problem is not the whole course. Sometimes it is one module, one lesson, even one awkward step in the flow.
Time spent matters too, though only when it is read in context. If users move through a lesson much faster than expected, they may be skipping it. If they stay too long, the material may be too dense or the structure may be unclear. Time alone does not explain much, but next to progress and interactions it becomes useful.
Interactions are the smaller signals that fill in the gaps. Video starts and rewatches, quiz attempts, clicks on supporting materials, downloads, repeated actions, exits, pauses between lessons—all of that helps show what learners are doing beyond simple completion numbers.
This is usually where teams start noticing things they would not catch otherwise. A lesson that looks fine from the content side may have weak engagement. A quiz may be opened often but abandoned halfway through. A resource may be heavily used, which usually means learners need extra support at that point.
Learning Performance Analytics
If behavior tracking shows what learners do, performance analytics shows how they are doing.
This is where the platform measures success more directly. Quiz results, assessment scores, failed attempts, pass rates, completion by skill level, progress against milestones—all of this helps answer a harder question: are learners actually getting the result the course is supposed to deliver?
This matters because activity can be misleading. A learner can spend time on the platform, open every lesson, and still finish with weak results. On the other hand, a course may have lower activity in some sections but still lead to strong outcomes. Performance analytics helps separate presence from progress.
It is also the part that exposes knowledge gaps. When many learners struggle with the same topic, fail the same assessment, or need several attempts to move forward, that usually points to a problem worth looking at. Sometimes the explanation is in the content. Sometimes it is in the sequence. Sometimes the course expects too much too early. Whatever the reason, the analytics gives the team something concrete to investigate.
This is especially important in products that work like learning management systems, where the platform is expected not just to host material, but to support structured learning and show whether that learning is happening.
A good eLearning analytics platform usually combines both sides. Behavior tracking shows how learners move. Performance analytics shows what that movement leads to. One without the other gives only half the picture.
Engagement and Retention Analysis
A course can look fine at first glance and still quietly lose people all the way through.
Users register, start learning, spend some time in the first modules, and then something changes. They come back less often. They stop finishing lessons. They skip assignments they would normally complete. A week later, they are gone. That is why engagement analysis matters. It helps teams notice the slowdown before it turns into churn.
This part of the analytics system tracks how actively people stay involved over time. Not just whether they showed up once, but whether they keep returning, keep learning, and keep moving forward. That includes things like repeat sessions, activity by week, unfinished modules, declining participation, and sudden breaks in progress.
Retention analysis looks at the same problem from the other side. It helps spot patterns that usually come before dropout. For example, a learner may stop opening lessons regularly, spend less time in the platform, or start abandoning quizzes halfway through. One event on its own may mean nothing. A pattern usually means something is going wrong.
This kind of data becomes especially useful in products that are moving toward personalized learning systems. The platform can use those signals to trigger reminders, adjust the flow, or offer support before the learner disappears completely.
Real-Time Analytics
Some problems are still useful when you find them in a monthly report. Others are only useful when you catch them right away.
Real-time analytics helps teams see what is happening in the platform as it happens. How many users are active now, where they are in the course, which lesson is getting unusual traffic, whether a quiz is suddenly causing trouble, whether engagement dropped after a new update. It is less about historical analysis and more about visibility in the moment.
This matters most when the platform has live sessions, timed assessments, large cohorts moving through the same material, or frequent content changes. If something breaks or starts underperforming, waiting for a later report is not much help. Teams need to see it early, while they can still do something about it.
The main value here is speed. Real-time analytics does not replace deeper analysis, but it gives instant signals when timing matters.
Custom Dashboards and Reporting
Not everyone needs the same dashboard.
An instructor usually wants to see who is falling behind, which learners are stuck, how a class performed on an assessment, and where progress slowed down. An admin often looks at bigger patterns: course completion, adoption, activity by group, usage trends, problem areas across the platform. For an organization, the view is wider again. They may need reporting by department, cohort, geography, or training program.
That is why custom dashboards matter so much in eLearning analytics. One standard set of charts is rarely enough. People need reports built around the questions they actually ask.
This is also where product quality becomes very obvious. Even useful data becomes frustrating when the interface is cluttered, slow, or hard to read. Good dashboards need clear structure, sensible filters, and a front end that can handle a lot of information without falling apart. Strong frontend development makes a difference. For interactive reporting interfaces with dynamic charts, filters, and role-based views, React development is often a practical choice.
The point of reporting is not to show that data exists. It is to make the data usable. That is a much harder job, and a much more important one.
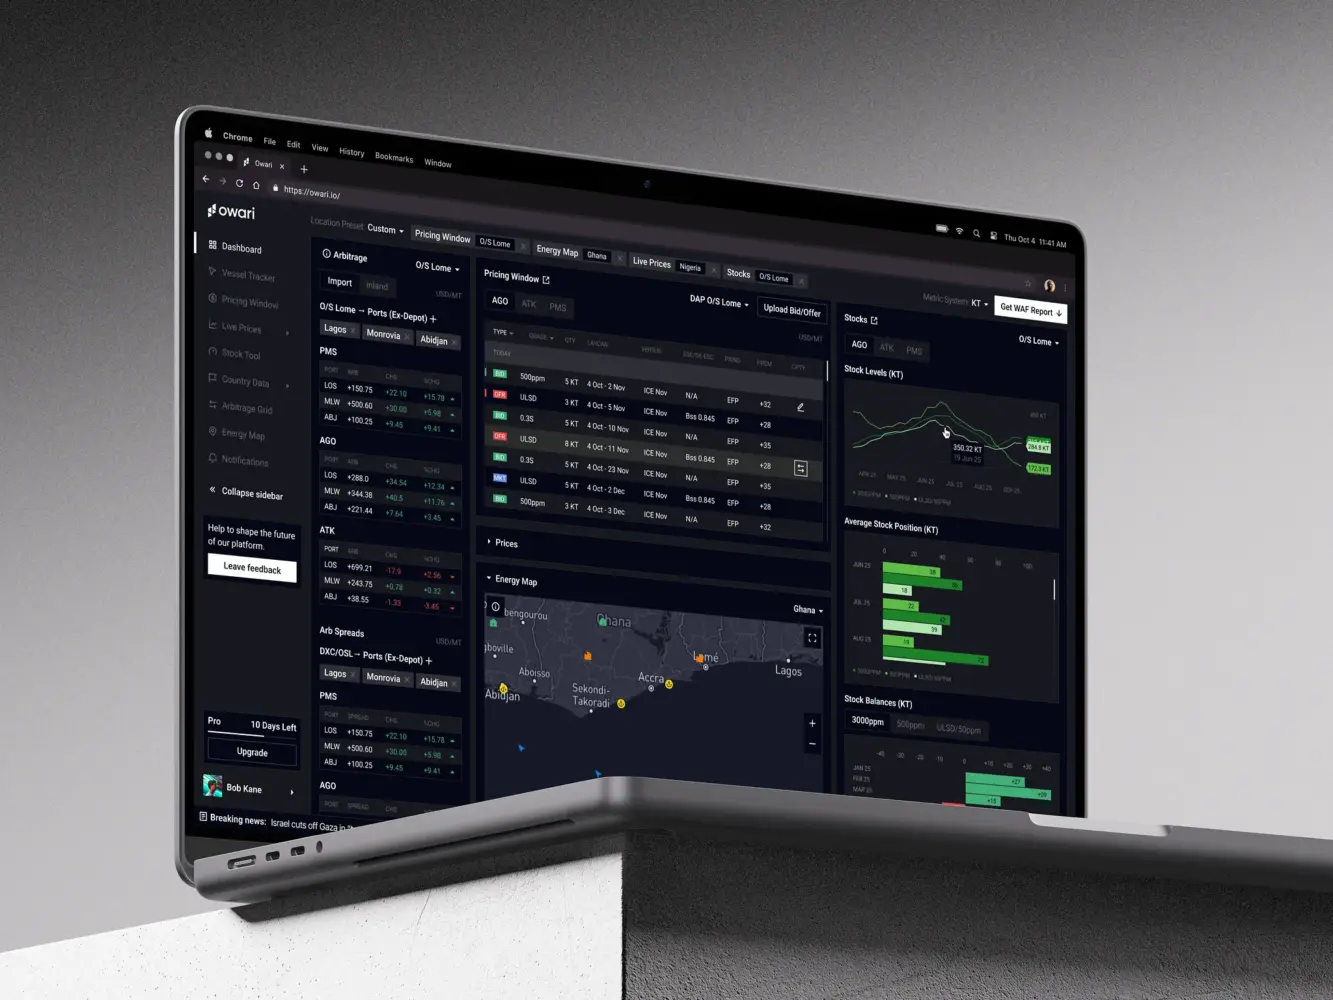
Dashboard Design for Stock Trading Platform by Shakuro
Data Analytics Platform Development Process
Building a data analytics platform for eLearning usually starts much earlier than the dashboard.
A lot of teams think about analytics when they are ready to “add reporting,” but by that point some of the important decisions have already been made badly or not made at all. If the platform is not collecting the right events, if the metrics are vague, or if nobody agreed on what success looks like, even a well-designed analytics layer will be limited.
That is why the development process usually begins with strategy, then moves into interface design, and only after that into the heavier implementation work.
1. Data Strategy and KPI Definition
The first step is defining key metrics. In an eLearning product, that may include course completion, lesson drop-off points, time spent in modules, quiz performance, retention by cohort, return frequency, progress speed, or assessment outcomes. The exact list depends on the type of product. A corporate training platform, a self-paced course business, and an academic learning system will not care about the same numbers to the same degree.
After that comes data sources. The team needs to map where the data will come from and how complete it really is. Some of it will come from the product itself: lessons, quizzes, logins, navigation, assignments, certificates. Some may come from connected systems such as CRM tools, payment flows, content services, LMS modules, or communication tools. This part matters because analytics gets messy very quickly when the data sits in too many places and follows different logic.
Then there are business goals. This is the part teams sometimes rush through, even though it is the reason the whole system exists. One company may want to improve retention. Another may want to prove training effectiveness for clients. Another may be trying to understand which courses perform well enough to scale. The platform should reflect those goals from the beginning. Otherwise the team ends up tracking everything and learning very little.
When this stage is done well, it gives the whole project a much stronger foundation. The analytics system stops being a random set of reports and starts becoming a tool built around real decisions.
2. UX/UI Design for Analytics Dashboards
Once the team knows what needs to be measured, the next question is how people will actually read and use that information.
This is where dashboard design becomes important. An analytics platform may be technically strong and still feel frustrating if the interface is cluttered, hard to scan, or overloaded with charts nobody understands. In practice, clarity matters more than visual complexity.
Good dashboard design starts with simple things: what should be visible first, what deserves emphasis, what can stay one click deeper, which filters people will use most often, and which comparisons really help. Instructors, admins, and business stakeholders usually need different views, so the structure has to reflect real tasks, not just available data.
Usability matters just as much. People should be able to understand what they are looking at without needing a long explanation. A chart should answer a question, not create three more. Trends, weak points, drop-offs, and progress should be easy to spot. If the interface makes users work too hard, the analytics may be accurate and still go unused.
This is also the point where front-end decisions start shaping the product. React development is great for analytics-heavy interfaces, especially when the product needs responsive, maintainable dashboard views rather than static reporting screens.
So even at this early stage, the job is not just to make analytics available. It is to make it readable, usable, and worth returning to.
3. Choosing the Technology Stack
The stack depends on how much data the platform has to deal with and how quickly that data needs to turn into something useful.
If the analytics layer is fairly simple, the setup can stay simple too. But once the platform starts collecting a steady flow of learner events, supporting heavier reporting, or showing live data, the technical choices start to matter much more.
For the backend, Python is a very common choice in analytics-heavy products for an obvious reason: it is comfortable to use for data processing. It fits well when the system needs to calculate metrics, process events, run background tasks, or prepare data for reporting. Node.js is also a reasonable choice, especially for API-heavy products or systems that need real-time features. Some teams pick one direction and stick to it. Others split the responsibilities. If the backend leans toward Python, FastAPI is often a practical way to build the API layer around analytics features.
Then there is the data side of the stack.
Apache Kafka is useful when the platform needs to handle a large stream of events without turning the whole system into a mess. Learner activity, quiz submissions, progress updates, content interactions—all of that can move through Kafka instead of being passed directly from one service to another. Apache Spark is a different story. It becomes relevant when the platform has enough data that transformations and processing start getting heavy.
For storage, PostgreSQL is often a sensible starting point. It is familiar, reliable, and works well for structured product data. But analytics workloads can grow away from the application database quite fast. When the platform needs to run heavier analytical queries across larger datasets, BigQuery is one of the options teams often use for that separate layer.
The same logic applies to infrastructure. Docker helps keep services portable and predictable. Kubernetes usually makes sense later, when there are enough services, environments, and scaling needs that manual management starts becoming a burden.
So this part is really about fit. The goal is not to make the stack look impressive. The goal is to choose tools that can support the product without making it harder to build and maintain. That is usually the difference between a clean analytics product and one that becomes unnecessarily complicated halfway through web development.
4. Data Pipeline and Architecture
This is where the platform either becomes dependable or starts causing problems later.
An analytics system only works if data moves through it in a clean and predictable way. That sounds obvious, but this is usually where things get messy. eLearning products generate data from many directions at once: course progress, lesson views, quiz attempts, video activity, session behavior, admin actions, notifications, third-party tools. Raw data comes in pieces, and those pieces do not line up neatly on their own.
That is why teams need proper pipelines.
Usually this means ETL or ELT. One approach transforms the data before it lands in storage. The other loads it first and transforms it later. Both are normal. The better choice depends on how the team wants to work with the data, how often metrics change, and how much flexibility the analytics layer needs.
What matters more than the label is whether the pipeline is stable.
If events are captured inconsistently, the reports stop being trustworthy. If the transformation logic is fragile, even a small reporting change turns into engineering work. If the storage layer is not built for analytics, dashboards get slower as the product grows, and sooner or later the team starts doubting the numbers.
And this usually happens earlier than expected. A learning platform does not need huge traffic to run into data problems. Once there are multiple courses, active cohorts, repeated assessments, engagement tracking, and retention reporting, the amount of data grows quickly enough on its own.
So the architecture has to be thought through from the start. Not in an overengineered way, but in a disciplined one. The platform needs a clear flow from event collection to storage to analysis. It needs data that can be processed at scale without constant patching. And it needs enough structure that adding a new dashboard or KPI does not break everything around it.
That is especially true in products with more mature SaaS data infrastructure, where analytics is already tied to product decisions, content changes, and operational reporting. At that point it is no longer some separate reporting module. It is part of how the platform works day to day.
5. Analytics Engine Development
Collecting data is only half the job. After that, the platform still has to do something with it.
That is where the analytics engine comes in. It takes raw product data and turns it into numbers, patterns, and reports people can actually use. Things like course completion, lesson-level drop-off, quiz performance, retention by cohort, progress over time, comparison across groups. Without this layer, the platform is just storing activity logs.
In a simpler product, the engine may only calculate core metrics and feed dashboards. In a more advanced one, it starts doing more than that: grouping users into segments, comparing behavior across courses, spotting weak points in the learning flow, or preparing data for deeper analysis later. The logic can get quite heavy, but the purpose stays simple. The system needs to turn scattered learner activity into something structured and readable.
This is also the point where reporting becomes a real product feature, not just a few charts added on top. The team has to decide which calculations run regularly, which reports need fresh data, how results are grouped, and how different users will access them. That is what makes the analytics layer feel closer to full data analytics platforms than to basic reporting.
6. Testing and Data Validation
This part is less exciting than dashboards, but it is where a lot of analytics products either become trustworthy or start causing problems.
The issue is simple: analytics can look perfectly fine on the surface and still be wrong underneath. A dashboard may load fast, the charts may look convincing, and the numbers may still be off because events were captured incorrectly or some rule in the pipeline broke the logic.
So first, the team has to check the data itself. Are events arriving at all? Are they duplicated? Are timestamps correct? Are lesson views, quiz attempts, completions, and user sessions being recorded in the way the system expects? If this part is shaky, the rest of the platform is shaky too.
Then comes validation of the outputs. If the report shows a certain completion rate, that number has to match reality. If engagement suddenly drops, the team needs to be sure it reflects actual user behavior and not some bug in tracking. This usually means comparing reports with source data, checking edge cases, and testing whether the same user flow produces the same result every time.
People forgive a lot in software. They do not forgive numbers they cannot trust. Once confidence in the analytics disappears, the whole thing becomes much less useful.
7. Deployment and Scaling
Once the system goes live, the real test starts.
Up to that point, the team is working in a controlled environment. After deployment, the analytics layer has to deal with real traffic, real reporting requests, real user behavior, and all the weirdness that comes with a live product. This is usually when weaker parts of the system become obvious. Maybe some reports are too slow. Maybe the pipeline lags behind. Maybe dashboards work fine with test data but struggle once the event volume starts growing.
That is normal. Analytics systems nearly always need adjustment after launch.
Scaling becomes the next issue. More learners means more events. More courses means more reporting logic. More clients or teams usually means more filters, more dashboards, more history, and more pressure on infrastructure. A setup that felt perfectly fine at the beginning can start feeling tight much sooner than expected.
So deployment is not really the end of development here. It is more like the point where the system starts living its real life. The team sees what needs tuning, what needs to be optimized, and which parts of the architecture will need more room as the product grows.
That is also why ongoing support matters. Analytics platforms are not static. New KPIs appear, reporting needs change, more data sources get added, and the product keeps evolving around the analytics layer. The system has to keep up with that without becoming unstable every few months.
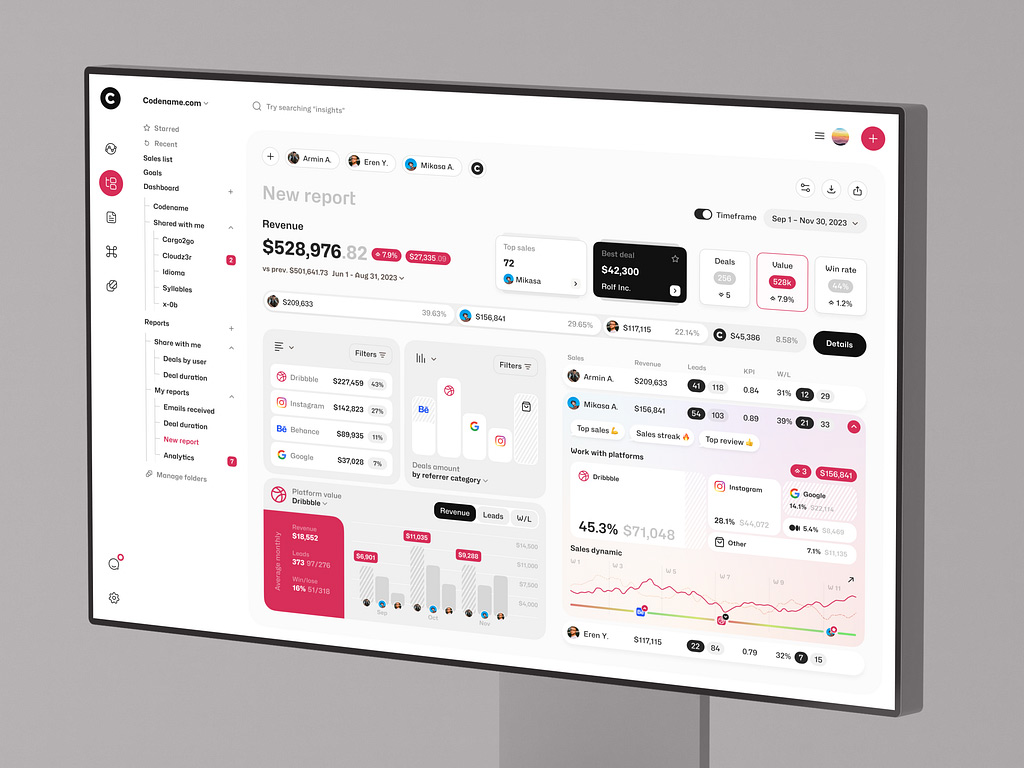
Sales Analytics Dashboard by Shakuro
Cost of eLearning Analytics Platform Development
The cost of this kind of product usually depends on how much data the platform has to deal with, how many systems it has to connect, and how fast the analytics is supposed to work.
A basic dashboard is one thing. A full elearning analytics software product with live data, custom reporting, multiple integrations, and more advanced analysis is a different level of work entirely. That is why pricing can vary so much from project to project.
- One of the biggest factors is data volume.
If the learning data platform tracks a small set of events, the setup stays relatively manageable. Progress through lessons, quiz results, completion rates, time spent—this is still a real analytics system, but not an especially heavy one. Once the product starts collecting large amounts of learner activity across many courses, cohorts, and user roles, the workload grows fast. More data means more processing, more storage, more pressure on queries, and usually more engineering time.
- Integrations affect cost too, often more than teams expect.
If most of the data comes from the platform itself, things are easier. But once the analytics layer has to pull data from LMS tools, CRM systems, internal admin systems, communication services, or third-party content tools, the work gets more complicated. Data has to be mapped, cleaned, checked, and kept in sync. And every external integration adds one more place where something can break later.
- Real-time processing is another cost driver.
If the business is fine with reports that refresh on a schedule, the architecture can stay simpler. If it needs live dashboards, immediate updates, or instant visibility into learner activity, the technical bar goes up. The system has to move data faster, process it faster, and keep the interface responsive while doing it.
- Then there is the actual depth of the analytics.
Some teams only need reporting: what happened, where learners dropped off, how courses performed. Others want much more from learning analytics platform development. They want segmentation, retention analysis, cohort comparisons, knowledge gap detection, forecasting, and more flexible reporting logic. That adds work on both sides: data processing in the backend and more complex dashboard behavior in the frontend.
The easiest way to think about cost is in scenarios.
- An MVP analytics dashboard is usually built around the essentials. A team may start with course progress, time spent, quiz performance, completion rates, and a few engagement metrics. The goal is to get visibility without turning the first version into a large analytics product. This kind of scope is usually the most reasonable starting point when the business wants to move faster and learn from real usage first.
- An enterprise analytics platform is a different story. It usually means more data sources, more user roles, more custom dashboards, more historical reporting, stricter permissions, heavier processing, and higher expectations around performance. At that point, analytics stops being a supporting feature and starts becoming a major product layer of its own.
So the cost of elearning analytics software is really a scope question. Not in the vague sense, but in a very practical one: how much data, how many moving parts, how fast, and how smart the system needs to be from day one. That is usually what sets the budget far more than the label on the project.
Common Challenges in eLearning Analytics Development
On paper, eLearning analytics sounds straightforward: collect learner data, process it, show useful insights.
In practice, this is the part where the product gets complicated.
- One of the first problems is data volume. Learning platforms generate far more activity than it may seem at first. Lesson views, quiz attempts, video interactions, progress updates, session history, notifications, repeated actions, cohort reporting—all of that adds up quickly. Even a product with a moderate number of users can end up processing a large stream of events every day. If the architecture is too narrow, reports slow down, dashboards become heavier, and simple analytics requests start taking more effort than they should.
- Data accuracy is another constant challenge. Analytics is only useful when people trust the numbers. That sounds obvious, but in real products it is easy for tracking to become inconsistent. One event may fire twice, another may be missed, a completion may be recorded too early, or a time-based metric may be distorted by session issues. Small tracking mistakes create larger reporting problems later. And once teams start doubting the data, the whole analytics layer becomes much less valuable.
- Real-time processing brings its own difficulties. Many teams want live dashboards or near real-time insight into learner activity, especially in products with large cohorts, scheduled training, or active instructor involvement. The problem is that real-time analytics raises the technical bar quite a bit. Data has to move faster, processing has to stay stable under load, and the interface still has to remain responsive. It is useful when the product really needs that speed, but it also makes the system more demanding to build and maintain.
- Privacy and compliance are another serious part of the work. eLearning platforms often deal with personal data, performance data, and behavior data all at once. That means analytics cannot be treated as a purely technical feature. Teams have to think about what they collect, why they collect it, who can access it, how long it is stored, and whether that setup matches the compliance requirements around the product. This becomes even more important in larger enterprise learning systems, where reporting may involve employee data, internal training records, and stricter governance expectations.
So the main difficulty in eLearning analytics development is not collecting more data. It is building a system that can handle enough volume, produce accurate outputs, respond fast enough when needed, and still stay responsible about privacy. That balance is where most of the real work is.
Our Experience in Data and EdTech Development
Building analytics products is rarely just about reports.
Most of the work sits deeper in the product: deciding what should be tracked, structuring the data properly, and making sure the interface helps people understand complex information without slowing them down. That kind of work is already familiar to Shakuro. We have experience with data-driven products where usability, system logic, and scalability all matter at the same time.
Experience with Data-Heavy Platforms
A good example here is Multifamily Modeling.
The company works with standardized and custom Excel-based financial models for investors and developers, so the challenge was not simply to design a better-looking website. The harder part was presenting complicated, detail-heavy information in a way that felt clear and trustworthy instead of technical and dry. One of the trickiest areas was finding a way to show Excel tables well on the web without making the whole experience feel heavy or confusing.
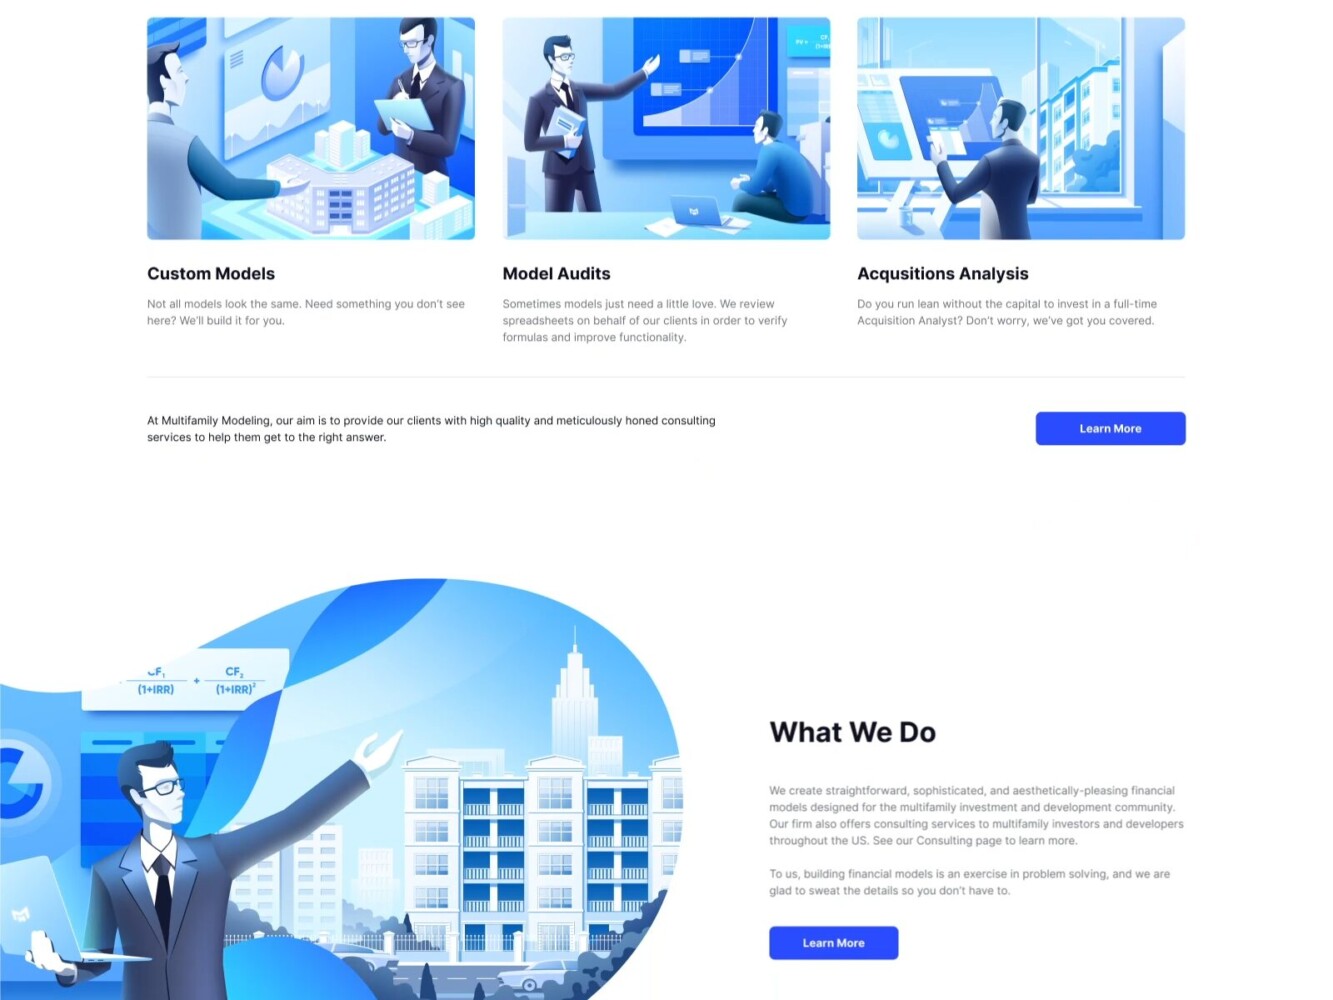
Multifamily Modeling Design by Shakuro
That kind of problem has a lot in common with analytics products. Raw data on its own is not especially helpful. It becomes useful when the platform gives it structure and presents it in a way people can actually work with. The project was also designed to be responsive and ready to grow with the business, which is the same mindset needed in scalable SaaS and analytics systems.
Another relevant case is Builddie. This project included not only a promotional website, but also a management platform design with a smart home interface and an energy monitoring dashboard. The product itself was built around AI-based energy logic and household sensor data, which meant the interface had to make technical information feel understandable for ordinary users. That is very close to the challenge in eLearning analytics too. A system may collect large amounts of data, but if the product cannot turn it into something readable and usable, the value gets lost very quickly.
Builddie Website Homepage by Shakuro
These projects are not EdTech platforms in the narrow sense, but they show the kind of experience that matters when building analytics systems for eLearning.
Shakuro has worked on products where complex information had to be structured carefully, where management interfaces had to stay clear under data-heavy conditions, and where the system had to be designed with growth in mind from the start. That includes work with analytics-style dashboards, SaaS logic, data-rich interfaces, and platforms that rely on clean architecture rather than one-off reporting features.
For eLearning products, that foundation matters a lot. Learning analytics only becomes useful when the platform can handle data pipelines reliably, present insights clearly, and keep scaling as more users, courses, and reporting needs appear. That is why experience with data-driven product design and SaaS-style platform development translates well into analytics-heavy EdTech systems.
Why Work with a Data Analytics Development Company
Once an eLearning product starts relying on reporting, learner insights, retention tracking, or performance analysis, the analytics system begins affecting the product much more deeply. It touches architecture, integrations, dashboard logic, data storage, and the way different teams make decisions. That is why many companies prefer to work with a team that already has experience building data-heavy digital products, not just general web interfaces.
One of the biggest advantages is scalable data architecture. A simple analytics setup may work at the beginning, but once the platform grows, weak decisions start showing up fast. Queries slow down, reports become harder to trust, and adding new metrics turns into extra engineering work. A development company with real experience in analytics systems is more likely to think about scale early, before those problems become expensive.
The second advantage is practical expertise in analytics systems themselves. Collecting data is not enough. It has to be structured properly, processed consistently, and turned into reports that make sense for instructors, admins, and business stakeholders. That kind of work takes more than backend implementation. It requires understanding how metrics are defined, how reporting logic is built, and how to make the output useful instead of just technically correct.
Integration is another reason this work often benefits from an experienced partner. Learning platforms rarely live on their own. They connect with LMS modules, communication tools, internal admin systems, CRMs, content services, and other product layers. The analytics system has to work across that complexity without becoming fragile. This is where experience with broader SaaS platforms becomes especially relevant, because the challenge is not just “add analytics,” but make analytics fit into a larger platform environment that keeps evolving.
So the value of working with a data analytics development company is not only in building the first version faster. It is in making better technical decisions early, reducing the risk of messy rework later, and building a system that can keep up as the product, the data, and the reporting needs get more demanding.
Final Thoughts
A good eLearning analytics system does more than collect activity logs.
It takes raw data, turns it into something teams can understand, and gives the product a clearer direction. That is really the chain here: data becomes insight, insight leads to optimization, and over time that shapes growth. Not in an abstract sense, but in the day-to-day work of improving courses, fixing drop-off points, supporting learners better, and making stronger product decisions.
What makes that work is not the number of dashboards or the amount of data collected. It is the quality of the foundation. The data has to be accurate. The insights have to be useful enough to act on. And the infrastructure has to be strong enough to keep working as the platform grows, the reporting gets heavier, and the product becomes more complex.
That is why data analytics in eLearning is worth treating as part of the platform itself, not as something to add later if there is time left in the budget. When it is built well, it helps companies see what is really happening in the product and improve it with much more confidence.
If you are planning to build a data-driven eLearning platform, it helps to start with the right architecture, the right analytics logic, and a product team that knows how to turn complex data into something clear and usable. Shakuro can help design and develop an eLearning system where analytics supports real product growth, not just reporting for its own sake.