For those who prefer to listen rather than read, this article is also available as a podcast on Spotify.
Contents:
Financial products generate a lot of data, often more than teams expect at the start. Payments, balances, market feeds, user activity—all of it accumulates quickly. At first, simple reports may be enough. But once operations grow, spreadsheets and basic dashboards stop answering the questions teams actually care about: where money is moving, what risks are forming, and how performance changes over time.
That’s usually when companies start thinking about custom financial analytics software. Off-the-shelf tools work for standard reporting, but financial workflows rarely stay standard for long. New integrations appear, reporting rules change, and data starts coming from several systems at once. To keep things manageable, teams build analytics platforms that can collect data from different sources, process it without long delays, and present results in a form that analysts and managers can rely on. In practice, this kind of work is common in teams focused on fintech development environments, where data accuracy and system reliability are treated as core requirements rather than optional improvements.
In this guide, we’ll look at how financial analytics platforms are structured and what makes them work reliably in production. We’ll go through the main system components, typical data architecture patterns, and the steps teams follow when building analytics software—from early planning to deployment. We’ll also touch on how AI-powered financial analytics is gradually being added to existing platforms, mostly to automate routine analysis and surface patterns that would otherwise take hours to detect.
What Is Financial Analytics Software?
Most teams don’t start with a full analytics platform. They begin with exported reports—files from accounting tools, payment systems, or bank dashboards. That works while volumes are small. But as the number of transactions grows, manual reporting becomes slow, and numbers from different systems stop lining up.
Financial analytics software solves this by pulling data directly from the systems where financial activity happens. Payment processors, internal ledgers, accounting tools, and APIs feed data into one place. Once the data is standardized, teams can build reports, monitor operations, and check performance without waiting for manual exports.
In day-to-day work, the value of these systems is visibility. Finance teams track revenue and expenses as they change. Risk teams watch for irregular transactions. Product teams use the same data to understand how financial features behave. Without a shared analytics layer, each team ends up working from its own dataset, which usually leads to delays and conflicting numbers.
Types of Financial Analytics Systems
Descriptive Analytics Platforms
Descriptive analytics is the most common starting point. It focuses on past activity—what happened, when it happened, and how results changed over time.
These platforms generate routine reports such as revenue summaries, expense breakdowns, and transaction trends. Most daily financial reporting depends on this layer, even in companies that later introduce forecasting or automation.
In practice, this stage takes more effort than expected. Historical data needs to be consistent, complete, and traceable. If reports don’t match or transactions are missing, more advanced analytics becomes difficult to trust.
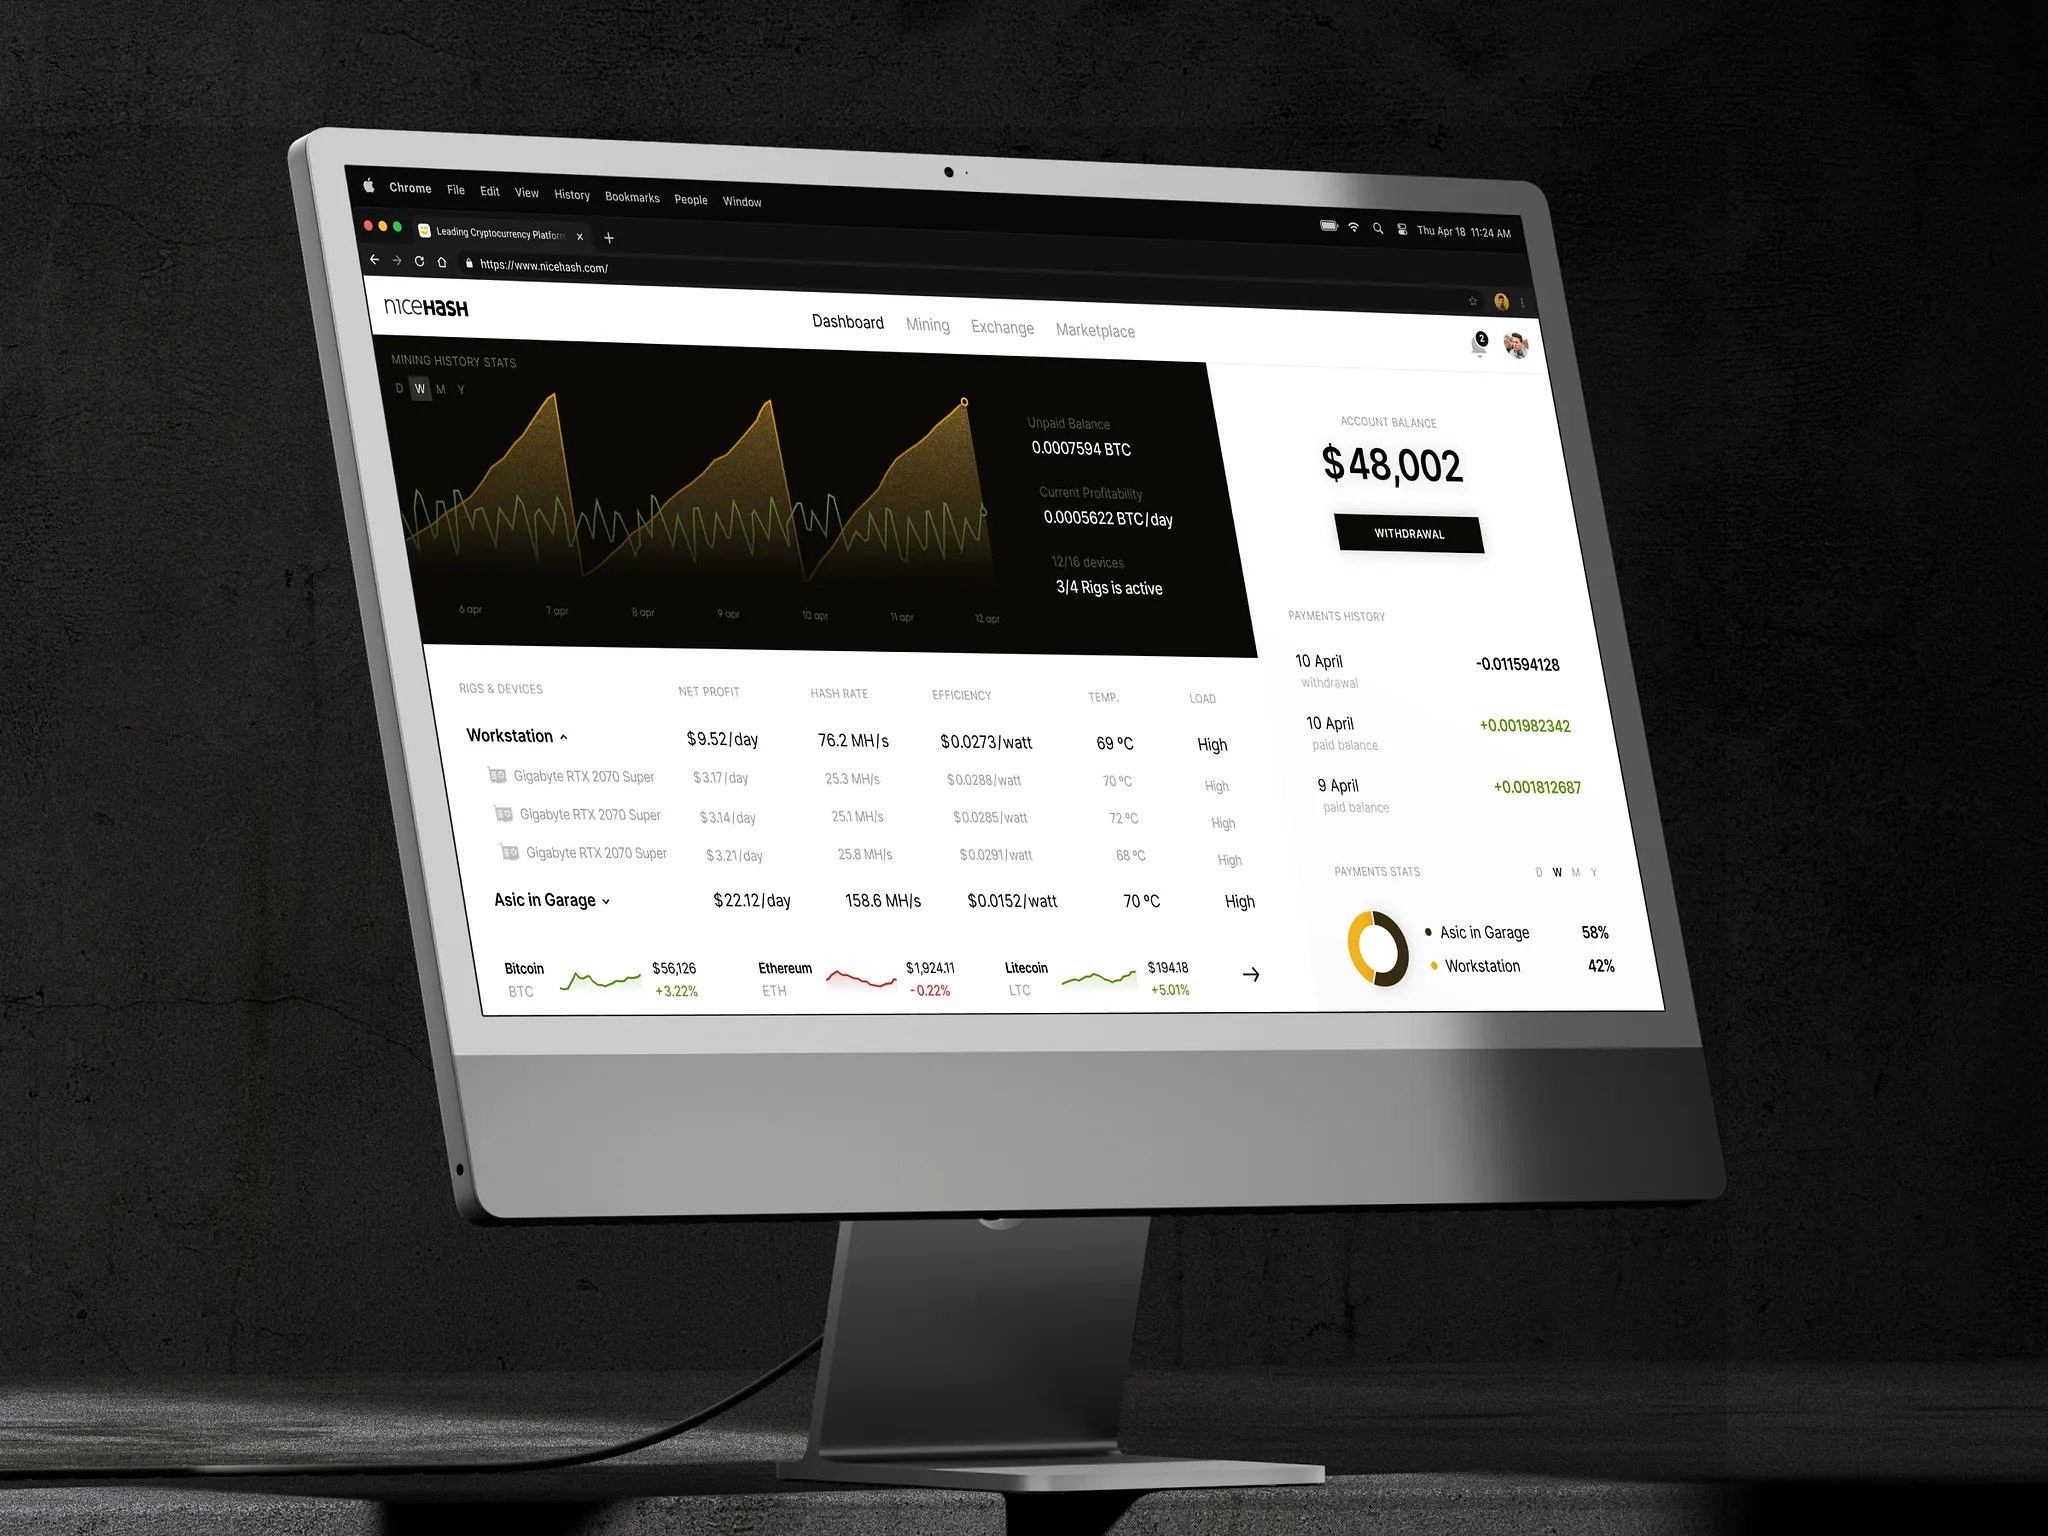
Financial Market Trading Analytics Tool Dashboard Design by Shakuro
Predictive Analytics Systems
Once teams trust their historical numbers, they usually want to look ahead. Not in a theoretical way, but for planning—budgets, reserves, hiring, risk exposure.
Predictive analytics in finance use past financial activity to estimate future outcomes. That might mean forecasting monthly revenue, estimating cash flow gaps, or modeling the chance of missed payments. In lending products, predictions often focus on default risk. In subscription-based fintech tools, teams look at usage patterns to estimate how income may change over time.
Real-Time Analytics Platforms
Some financial operations don’t leave room for delays. Waiting until the end of the day to review transactions isn’t always acceptable, especially when fraud or trading activity is involved.
Real-time analytics platforms process events the moment they arrive. A payment goes through, a balance changes, or a trade is executed—the system reacts immediately. If something looks unusual, alerts can be triggered without waiting for scheduled reports.
This kind of setup is common in environments built around speed, including real-time trading analytics systems, where even small delays can lead to financial losses. Systems like these rely on streaming data rather than batch updates, which changes how the infrastructure is designed from the start.
Core Components of Financial Analytics Platforms
Most users see only dashboards, but the real work happens underneath. Financial analytics platforms rely on several parts working together. If one layer fails, the whole system becomes unreliable.
Data Pipelines
Data pipelines move financial records from source systems into the analytics platform. Sources vary—payment processors, accounting tools, internal ledgers, third-party APIs.
But pipelines don’t just move data. They fix formatting issues, remove duplicates, and fill in missing fields where possible. Without that cleanup step, reports drift out of sync very quickly. Many teams discover this the hard way when numbers from different reports don’t match.
Data Warehouses
Once collected, data needs stable storage. That’s the role of the data warehouse.
Warehouses are built for analysis, not transactions. They keep historical data organized so teams can compare months, quarters, or years without slowing down live systems. As datasets grow, this separation becomes less of an option and more of a necessity.
Analytics Engines
The analytics engine is where calculations happen. It takes raw records and turns them into totals, trends, or derived metrics.
In early versions, this layer may only handle basic calculations. Later, teams add forecasting logic, automated checks, or rule-based alerts. Over time, this component often becomes one of the most heavily maintained parts of the system.
Visualization Dashboards
Dashboards are what most users interact with. They show results in a form that can be scanned quickly—charts, tables, summary metrics.
Good dashboards don’t overload users with details. They focus on the numbers people check repeatedly. Revenue, balances, transaction volume—things that signal whether the system is healthy or drifting off course.
API Integrations
No financial analytics platform exists in isolation. It has to exchange data with other systems.
APIs handle that exchange. They bring in new records from external services and send processed results back out. For example, analytics results may feed alerting tools or reporting systems used by other teams. When APIs are planned well early on, adding new integrations later becomes much easier.
Key Features of Financial Analytics Software
Most financial analytics platforms end up with a similar set of features, even if the products themselves are different. Without these basics, the system either misses data or becomes difficult to maintain once the number of integrations grows.
Data Integration and Processing
Financial data almost never comes from one place. A typical product pulls records from banking systems, payment platforms, internal ledgers, and sometimes trading services. Each source sends data in its own format, with its own rules.
That mismatch creates problems quickly. One provider may label transactions one way, another uses different naming. Time formats may not match. Currency fields may be structured differently. If those differences aren’t handled early, reports start drifting apart, and teams spend time reconciling numbers instead of analyzing them.
Integration layers handle this cleanup. They collect incoming records, adjust formats, and bring data into a common structure. In payment-heavy systems, this usually ties into building a stable payment data infrastructure, where every transaction must be traceable from the source to the final report.
Most teams discover that integrations never stay static. New providers are added, APIs change, and data formats evolve. Systems built with flexible integration logic cope with these changes much better than rigid ones that expect everything to remain the same.
Real-Time Analytics
Some financial data can’t wait until the end of the day. Payments, trades, and balance changes need to be checked as they happen, not hours later.
Real-time analytics handles events the moment they arrive. A transaction is created, a price changes, a user moves funds—the system processes that update right away. If something unusual shows up, it can be flagged immediately instead of sitting unnoticed in a queue.
This matters most in systems that deal with constant streams of data. Trading platforms are a typical case. Market data arrives nonstop, and the analytics layer has to keep up without slowing the rest of the product. Payment systems face a similar problem when thousands of transactions pass through every second.
In practice, real-time features appear when delays start causing trouble. If reports arrive too late to be useful, teams switch from scheduled processing to continuous streams.
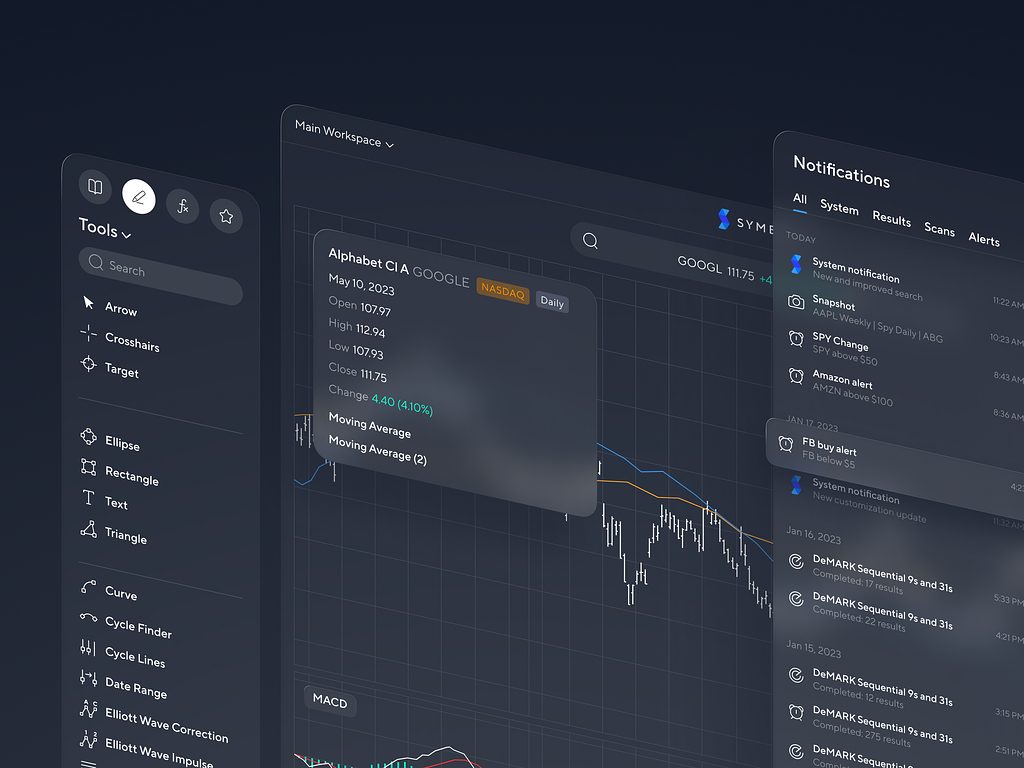
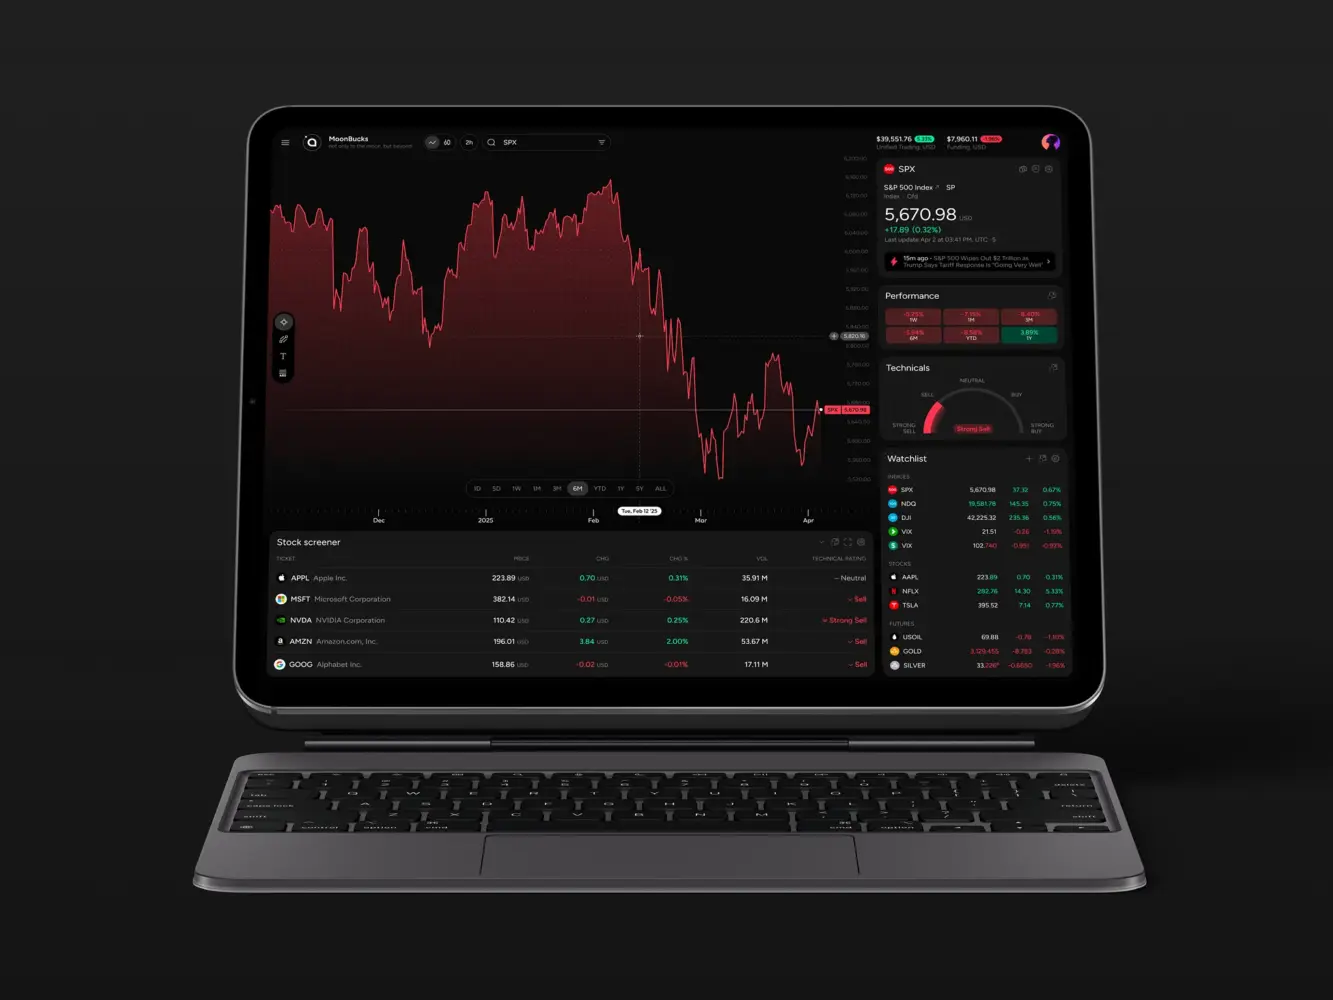
Stock Market Analytics Application by Shakuro
Data Visualization and Dashboards
After data is processed, someone still has to read it. That’s where dashboards come in.
Most teams don’t work with raw tables unless they have to. They look at summaries—charts, totals, comparisons over time. Revenue, balances, transaction counts. The numbers people check every day.
Interactive dashboards make that work faster. Instead of requesting a new report each time, users filter data themselves, change time ranges, or open specific records when something looks off. Different teams often need different views, so custom reporting tools become part of the system sooner or later.
Performance matters here more than design style. If dashboards load slowly or freeze when datasets grow, people stop relying on them. That’s why this layer is usually built with scalable frontend development practices, especially in products where the amount of data increases month after month.
Risk Analysis and Monitoring
A lot of financial analytics work is about catching issues early, not just tracking results.
Most problems first show up as small irregularities. A payment that looks larger than usual. Several failed attempts from the same account. Activity that suddenly jumps without an obvious reason. In lending tools, missed repayments are often the first warning sign. In payment products, teams watch for patterns that don’t match a user’s normal behavior.
Regulatory requirements make this work unavoidable. Financial records have to be traceable from start to finish. Auditors usually ask for exact timelines—when the transaction started, what changed, and how it was completed. Because of that, analytics tools are often tied closely to financial risk management systems, where every step of a transaction has to remain visible.
Nothing here stays fixed for long. Risk thresholds change. New checks are added. Older rules get replaced when they stop catching real issues.
API and Integration Capabilities
Financial analytics tools spend most of their time receiving and sending data.
Records usually come from payment services, banking systems, and other internal tools. APIs handle that exchange. Data moves in automatically, gets processed, and may be passed further—to alerts, reports, or partner systems. When APIs are unreliable, teams fall back to manual exports, and errors start to pile up.
Some products also work with external ledgers. In those cases, blockchain data integration is used to pull transaction records into the same dataset used for reporting and monitoring.
This part of the system tends to grow quietly. New providers get connected, older ones change their interfaces, formats evolve. Teams that rely on solid web development services practices usually handle these changes without major disruptions.
Financial Analytics Software Development Process
Most analytics projects begin with sorting out the data. Before dashboards or charts appear, teams need to understand what data exists and what questions it should answer.
1. Data Strategy and Requirements Analysis
Work usually starts with listing data sources.
Payment providers, banking services, internal ledgers, sometimes trading feeds. Each source sends data in its own way. Some push updates every few seconds. Others update in batches. Those differences affect how pipelines are built later, so teams document them early.
Metrics come from daily operations. Revenue totals, failed payments, settlement delays, balance changes. The numbers people already check manually often become the first metrics inside the system.
KPIs grow out of the same workflow. Transaction success rate, processing time, number of failed operations. Nothing theoretical—just what reflects real system behavior. When this stage is rushed, missing data usually shows up later, after financial analytics software development has already started.
2. UX/UI Design for Analytics Platforms
Design work here focuses on readability more than decoration.
Dashboards are planned around routine use. Finance teams open them every day, often under time pressure. Key numbers need to be visible without searching through multiple screens.
Most early versions stay minimal. A few charts, a few totals, recent activity. Extra views appear later, usually after users request more detail. Overloaded dashboards slow people down instead of helping them.
Performance problems often show up at this stage. Large datasets make weak interfaces feel sluggish. Many teams rely on stable React development setups so dashboards can refresh frequently without freezing when data volume increases.
3. Choosing the Technology Stack
Stack decisions tend to follow the kind of work the system does every day.
If most of the effort goes into calculations and data cleanup, Python often ends up in the backend. In products already built around JavaScript services, Node.js fits naturally. Java still appears in long-running financial systems where stability matters more than fast iteration.
Traffic changes the picture quickly. When records start moving between services all the time, tools like Kafka are used to pass events without slowing requests. When datasets grow large enough to slow down reports, Spark is often introduced to split calculations across multiple workers.
Databases rarely stay the same forever. PostgreSQL is common early on because it handles structured financial data without much setup. As historical data builds up, analytical storage—BigQuery or Snowflake—gets added so large queries don’t interfere with production workloads.
Infrastructure grows in the same way. Docker helps keep environments consistent. Kubernetes shows up later, usually when there are too many services to manage by hand.
API performance becomes noticeable once dashboards start refreshing frequently. Many teams build backend services using tools associated with FastAPI development, especially when response times matter. On the client side, steady frontend development practices help keep dashboards responsive even when datasets become heavier.
4. Data Architecture and Pipelines
After the stack is in place, the real question becomes simple: how does data travel through the system.
Every record follows a route. Payment logs move from external services into storage. Ledger updates follow their own path. Account activity lands in tables used later for reports. Those routes form the pipeline.
Early versions are often basic. Scheduled jobs pull data every few minutes or hours. That setup works until volume increases or new sources appear.
More data means more pressure on the pipeline. Updates arrive faster. Failures become harder to spot. Without clear structure, small issues spread quickly across reports.
Transformation happens along the way. Some teams clean data before storing it. Others load raw records first and process them later. Both patterns exist in real systems.
Load reveals weak spots. A sudden jump in transaction volume exposes slow queries or overloaded workers. Systems built around scalable financial transaction data pipelines handle growth more calmly, especially in products that process payments or settlements every minute.
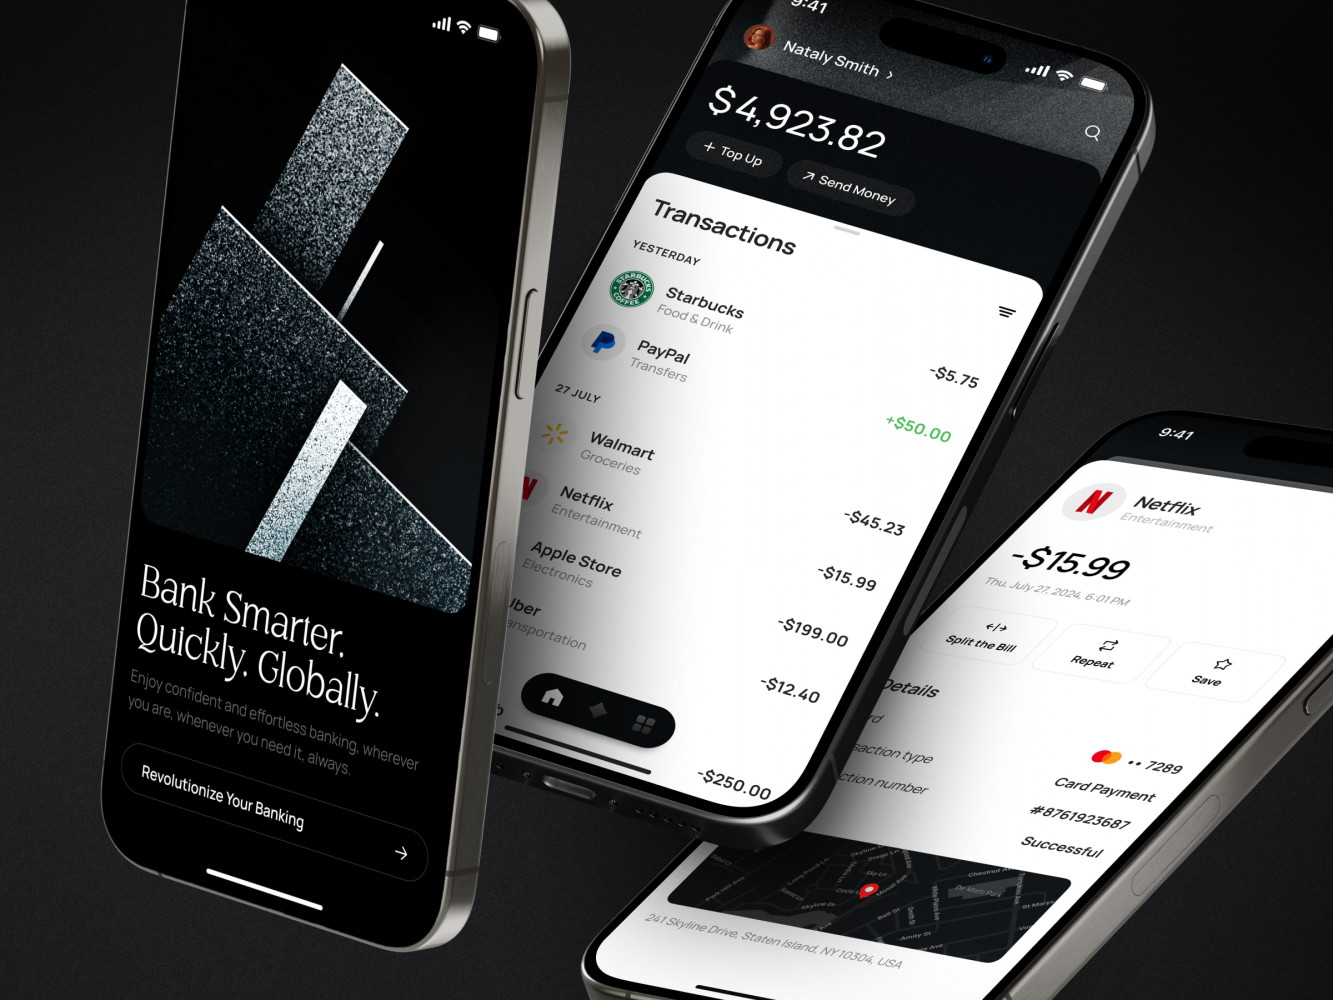
Finance Management Mobile App Design by Shakuro
5. Analytics Engine Development
This part is about turning records into numbers people recognize.
Most teams start small. Daily totals. Transaction counts. Balance changes. The same numbers that used to live in spreadsheets. Nothing complex at first. Just making sure the math holds up when data comes in continuously.
Extra logic shows up later. Forecasts, alerts, comparison over time. Usually after users begin depending on the reports and start asking for more detail.
In systems linked to data-driven trading systems, load shows up quickly. Market updates arrive nonstop. If calculations slow down, dashboards lag. That’s usually when performance tuning begins.
Writing formulas isn’t the hardest part. Keeping them stable when data volume grows—that’s where time goes.
6. Testing and Data Validation
Most problems surface when numbers don’t match.
Teams compare reports with the original records. Line by line in some cases. Missing transactions turn up. Duplicate rows too. Timestamp errors show up more often than expected.
Timezone mistakes are common. So are rounding differences. Small details, but once reports depend on them, the impact spreads.
Historical data gets reused during testing. Old transactions are pushed through the same logic to see if results stay consistent. If totals drift, something upstream is wrong.
Large datasets expose slow queries almost immediately. What looked fast during early testing slows down once full history is included.
7. Deployment and Maintenance
Production always behaves differently from test environments.
External services send data in formats nobody saw before. Some records arrive late. Others show up twice. Pipelines that worked fine earlier start showing delays.
After launch, monitoring becomes routine. Failed jobs need restarts. Storage grows month by month. Logs become the main source of truth when something breaks.
The system keeps changing. New providers get added. Old ones update their APIs. Reporting requests grow as teams start trusting the data more.
Long-term reliability usually depends on steady support services. Not big redesigns—small fixes, regular updates, and watching for slowdowns before users notice them.
Cost of Financial Analytics Software Development
Cost usually depends on what happens behind the dashboards. The visuals may look simple, but the data flow underneath tells the real story.
Data infrastructure complexity
Small systems cost less because the data path stays short. A few sources, limited history, scheduled updates. Things get heavier when data comes from several systems or needs transformation before storage. Streaming data, backups, and long-term retention add work that isn’t obvious from the outside.
Number of integrations
Every integration adds effort. Payment tools, banking APIs, accounting platforms, trading services—each one behaves differently. Formats don’t match. Error handling takes time. APIs change, so integrations rarely stay finished for long.
Real-time processing requirements
Scheduled updates are easier to support. Real-time flows demand faster pipelines and tighter monitoring. Systems that react instantly—fraud checks, balance tracking, trading activity—require more testing and stronger infrastructure.
Analytics model complexity
Basic reporting is predictable. Totals, trends, comparisons. Costs rise when logic becomes heavier—forecasting, anomaly detection, simulations. More calculations mean more testing and tuning.
Example Scenarios
Actual budgets vary, but project shapes repeat often.
MVP analytics dashboard
Usually built around a small number of data sources. One or two integrations. Scheduled updates instead of live streams. A handful of dashboards showing core numbers. Many teams start here to test ideas before committing to larger financial data platform development work.
Enterprise financial analytics platform
Much broader scope. Multiple integrations running at once. Real-time data flows. Large historical storage. Role-based dashboards and stricter reporting rules. Systems at this level are often handled by a financial analytics software company that already works with complex financial environments.
Common Challenges in Financial Analytics Development
Most teams don’t hit major issues on day one. Trouble starts later—after integrations multiply and historical data builds up.
Handling large volumes of financial data
Data grows quietly. At first, reports load fast. Storage looks manageable. Then history accumulates—months turn into years of transactions.
That’s when slow queries begin to show up. Dashboards take longer to open. Jobs that used to finish overnight start running into the next day. The system itself hasn’t changed much—the amount of stored data has.
Teams usually notice the problem when routine reports start missing their expected schedule.
Ensuring data accuracy and consistency
Different systems describe the same transaction in different ways. One writes timestamps in UTC. Another uses local time. Some round currency values differently.
At first, mismatches look small. A few cents off. One missing row. Later those differences spread into summaries and totals. Finance teams notice when numbers from separate reports stop matching.
Fixing this often turns into detective work—tracking a single record from its source all the way to the final table.
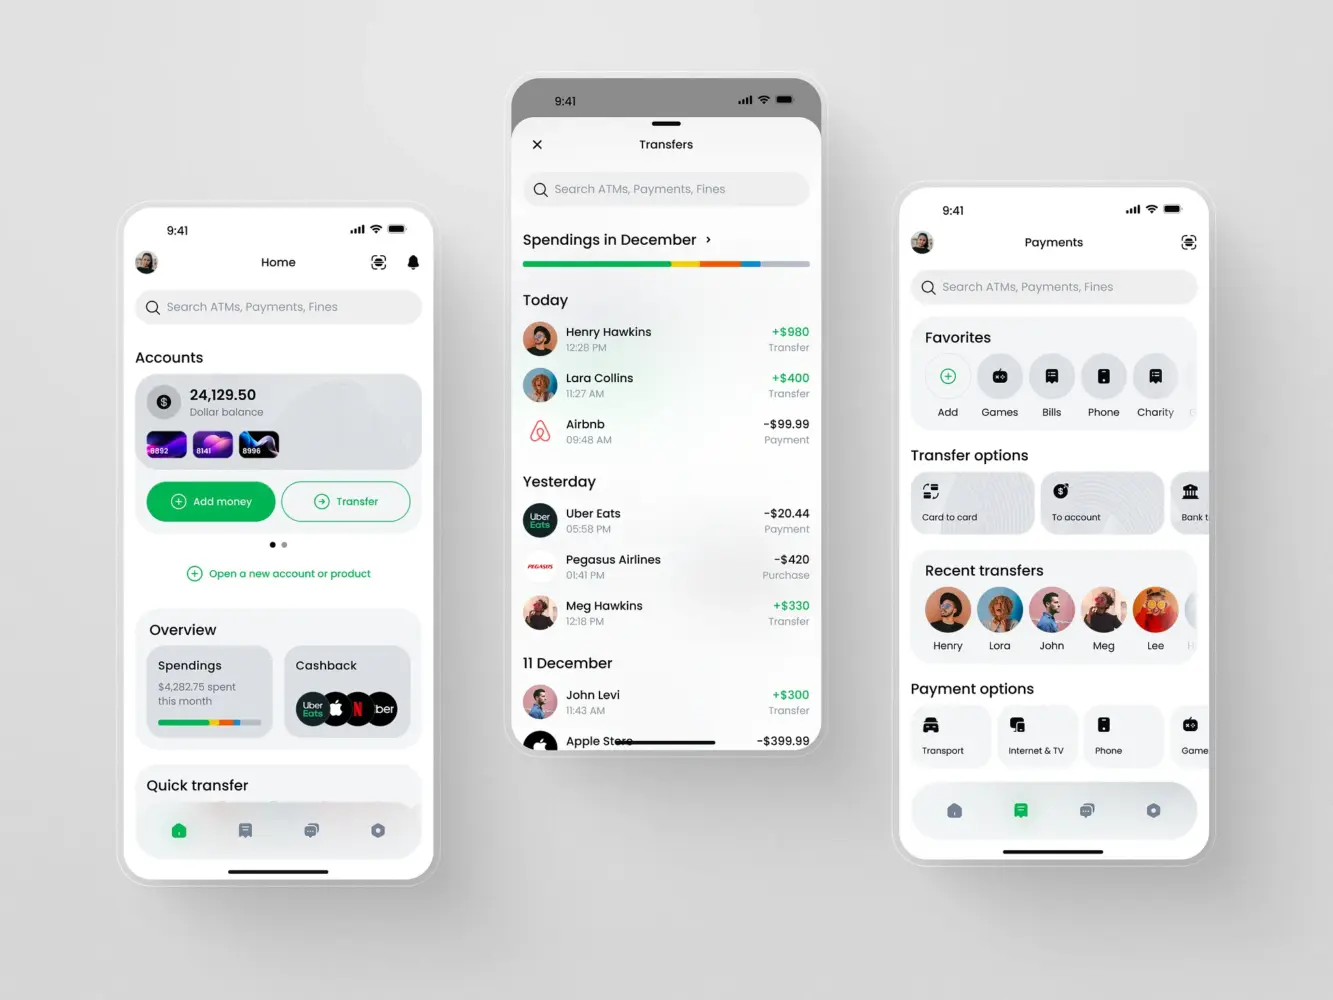
Finance Management Mobile App by Shakuro
Real-time processing challenges
Streaming data behaves differently from scheduled updates. There’s no pause between batches. Records keep arriving.
Slow queries become visible immediately. So do network delays. External APIs don’t always respond at the same speed, which creates uneven data flow.
Systems connected to DeFi data analytics systems face another complication—data can arrive out of sequence, depending on network timing.
Data security and compliance requirements
Security work grows alongside the system. More users, more data, more places where access needs to be controlled.
Audit logs become critical. Encryption settings need review. Permissions change as teams expand.
Most compliance problems show up during audits, not during development. Missing records, incomplete logs, unclear access history—things that didn’t seem urgent earlier suddenly matter a lot.
Our Experience in Financial and Data Platform Development
Most data-heavy products follow the same path. At the start, the dataset is small and reports feel manageable. Later, integrations increase, history grows, and queries that once ran instantly begin to slow down. That’s when structure matters more than visuals.
Much of our work sits inside fintech and SaaS products where analytics isn’t optional—it’s part of daily use. These systems deal with trading history, portfolio metrics, financial reports, or other datasets that grow every day.
Two projects below show how these patterns appear in practice.
TraderTale—Turning Trading Activity Into Reputation
TraderTale revolves around trading history. Each trade feeds into a profile that reflects long-term activity rather than isolated wins or losses.
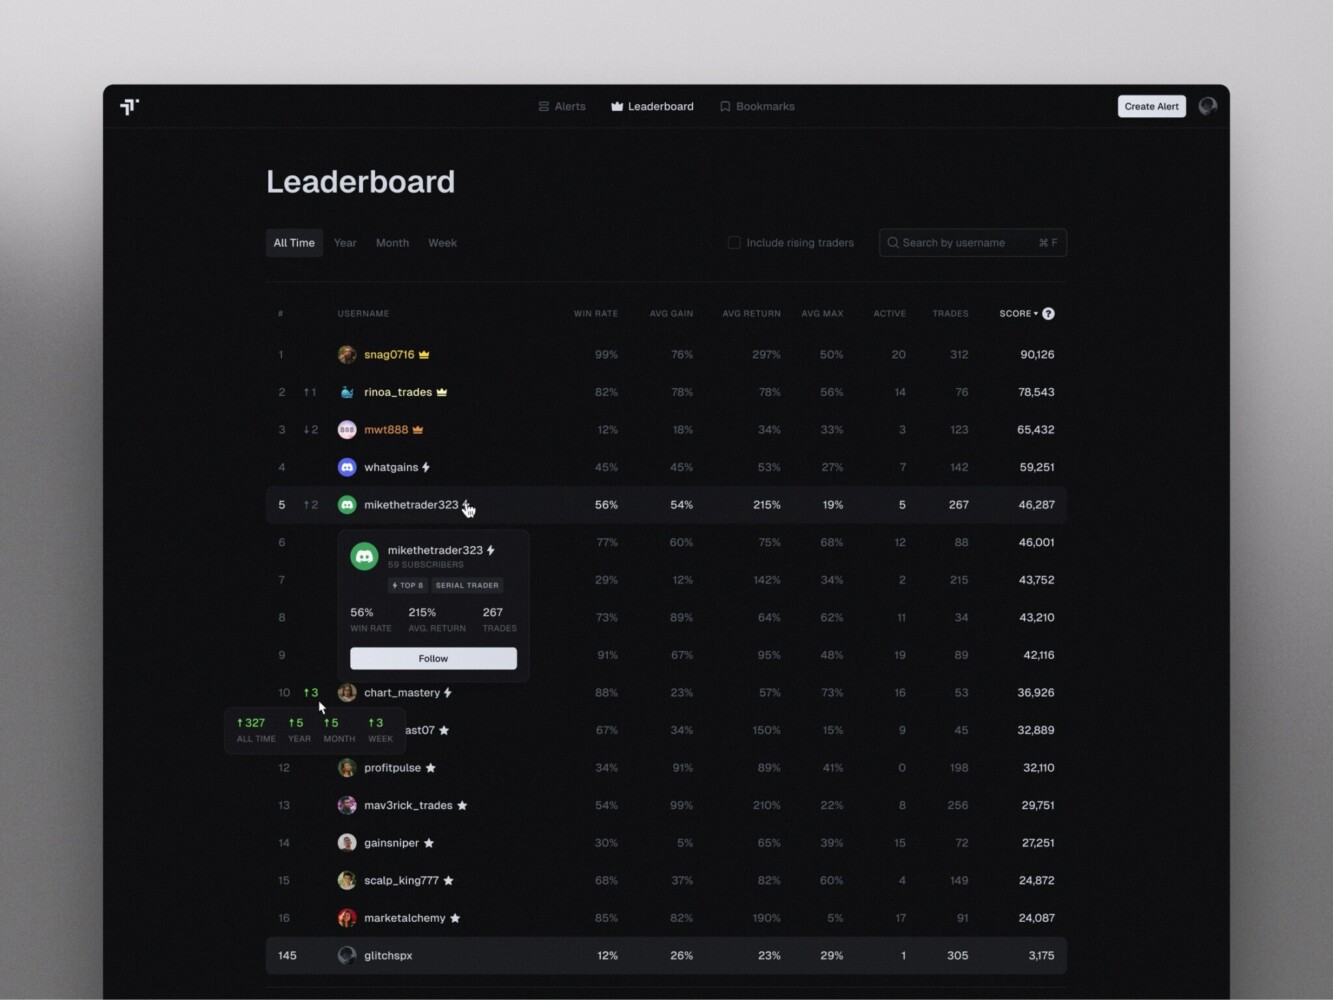
Leaderboard in TraderTale by Shakuro
The data itself was already available. The difficulty showed up when the number of records increased. Screens that worked early became crowded. Leaderboards, alerts, and profile views all needed to display detailed metrics without turning into noise.
Work focused on reorganizing how information appeared on screen. Leaderboards highlighted consistency across time. Alerts were arranged as streams so users could scan activity quickly. Profiles gathered statistics and history into one place instead of spreading them across multiple views.
Typography and layout stayed restrained. Trading interfaces carry a lot of numbers, and decoration quickly becomes a distraction. The design had to remain readable after more users and more trades were added.
Over time, the platform supported steady growth in activity without losing clarity in its data views.
Four Pi Capital—Structuring Financial Research Output
Four Pi Capital works with research rather than live transaction streams. Their output consists of detailed reports covering companies, industries, and broader financial conditions.

Four Pi Analytics Website Design by Shakuro
The challenge here centered on structure. Research reports tend to grow large, and readers need to move through sections without losing context. Layout choices affected how quickly someone could find charts, summaries, or key conclusions.
The brand identity followed the same principle. The idea of four pillars—linked to the founding partners—became the base for the visual language. That structure appeared in the logo and in document layouts.
Printed reports required careful handling. Paper choice, illustration style, and layout spacing all influenced readability. In financial research, presentation supports credibility—readers expect information to feel organized and deliberate.
The website mirrored that logic. It displayed metrics, research areas, and company background in a clear sequence, acting as an introduction to the firm’s analytical work.
Where These Projects Connect to Analytics Platforms
The industries differ, but the technical patterns look familiar.
Large datasets that keep growing. Repeated reporting workflows. Interfaces opened daily by users who depend on reliable numbers.
Products inside fintech and SaaS environments tend to converge around these needs. Once reporting becomes routine, the system behaves more like infrastructure than a simple interface.
Both projects reflect the same themes discussed earlier—structured pipelines, consistent records, and interfaces that remain usable as data volume increases.
Why Work with a Financial Analytics Software Development Company
Financial analytics systems have a habit of growing beyond their original scope. A few reports turn into dozens. One data source turns into five. Storage that felt large at the beginning starts filling up faster than expected.
Scale is usually the first real pressure point. Systems built around small datasets behave differently once history builds up. Queries slow down. Dashboards take longer to refresh. Pipelines that once ran quietly begin missing schedules. Financial analytics developers that have dealt with large financial datasets before tend to expect this shift and design around it early, especially in projects tied to fintech workflows where data never stops accumulating.
Analytics logic also changes over time. Early reports stay simple—totals, comparisons, daily summaries. Later, users ask for breakdowns, alerts, and longer historical views.
Integrations bring their own share of problems. Payment services behave differently from banking APIs. Field names don’t always match. Some providers change their formats without warning. Most teams underestimate how much time goes into keeping integrations stable.
Traceability becomes important once the platform is widely used. Teams need to know where numbers came from and how they changed. Logs help. So does clear data lineage. These details don’t draw attention during early financial analytics platform development, but they matter later when audits begin or reports are questioned.
Working with a financial analytics software company that has already built similar systems doesn’t remove risk, but it usually reduces surprises. The patterns repeat across projects—growing datasets, shifting integrations, expanding reporting needs. Systems built with those patterns in mind tend to hold up longer without major rebuilds.
Final Thoughts
Financial analytics platforms rarely come together in a single step. Most follow the same path—data strategy first, then architecture, then financial data platform development, and finally deployment under real traffic. Each stage builds on the previous one, and mistakes early in the process tend to show up later when data volume grows.
Strong platforms depend on a few things that don’t change from project to project. Clean, reliable data. Infrastructure that can handle growth without constant rebuilding. Systems that deliver insights fast enough to be useful, not hours after the fact.
At Shakuro, much of this work comes from hands-on experience with financial and analytics-heavy products—from trading platforms to structured research tools and SaaS reporting systems. Projects like those described above reflect the same patterns seen across fintech environments: growing datasets, expanding integrations, and dashboards used every day by real users.
Companies planning new analytics tools—or rebuilding older ones—usually benefit from working with teams that have already handled these conditions in production. That experience shortens the learning curve and reduces the risk of redesign once the system starts scaling.