Sports analytics software development means building a system that collects data from wearables, video, sensors, and manual stats and turns it into dashboards, alerts, reports, and predictions for coaches, analysts, and managers. An MVP that ingests one data source and shows basic load metrics costs roughly $40k–$120k and takes about 3–4 months. A mid-level platform with several data sources, real-time dashboards, and basic predictive models costs $150k–$500k over 6–9 months minimum. An enterprise system with advanced ML, full video sync, and SOC2/HIPAA compliance runs $750k–$3M+ and a year or more.
Custom development is not always the answer: for 80% of teams, ready-made tools like Catapult or Hudl are perfectly fine. Custom pays off when you need unique workflows, proprietary models, many data sources in one place, or a branded product, and when you have a sports tech development company or in-house team to maintain it.
Below, we cover features, architecture, the development process, tech stack, challenges, cost, custom vs ready-made tools, and when development services make sense.
What Is Sports Analytics Software?
At its core, it is just a digital product that collects, processes, visualizes, and interprets sports data for decision-making. It’s the difference between guessing and knowing. It’s taking the chaos of a 90-minute match or a four-quarter grind and turning it into something you can actually use.
Now, here’s where it gets a bit messy. Not all “sports analytics” is created equal. You’ve got your ready-made tools, then you’ve got custom platforms, dashboards, and those internal systems teams build themselves. They’re different beasts.
Ready-made tools are like buying a suit off the rack. They fit okay, maybe even well if you’re average height. They’re great because you don’t have to build anything. You sign up, you plug in your data, and boom—you have heat maps, player load metrics, basic stats. It’s fast. It’s cheap-ish. But you’re stuck with what they give you. If you want a specific metric that combines heart rate variability with sprint distance in a weird way? Good luck. You probably can’t do it.
Custom software is the tailored suit. Or maybe the bespoke one, if you’ve got the budget. Teams spend months building their own platforms because the off-the-shelf stuff just didn’t cut it. Maybe they’re a pro franchise with proprietary scouting algorithms. Maybe they need to integrate video analysis with biometric data in real-time during a game. Ready-made tools choke on that. Custom platforms let you define the rules. You decide what data matters. You build the visualizations that make sense to your coaches, not some generic template.
But building custom sports analytics software is a headache. It really is. You need developers who understand sports, which is a rare breed. Most devs know code; they don’t know what a “pick-and-roll efficiency rating” actually means in context. So you spend half your time explaining the sport to them. It’s frustrating.
Dashboards are another layer. Sometimes you don’t need a whole new system; you just need a better way to see the data you already have. Just dumping it into a clean, interactive dashboard—using something like Tableau or Power BI, or even a custom React frontend—changes everything. Coaches don’t want to read CSV files. They want to see a red dot where a defender was out of position.
Internal team systems are the quiet heroes. The stuff nobody sees. Maybe it’s a simple database that tracks injury history alongside training load. Or a messaging app integrated with performance stats so coaches can send personalized feedback to players. But it keeps the organization running. It connects the medical staff with the strength coaches with the tactical analysts. Without that glue, everyone is working in silos.
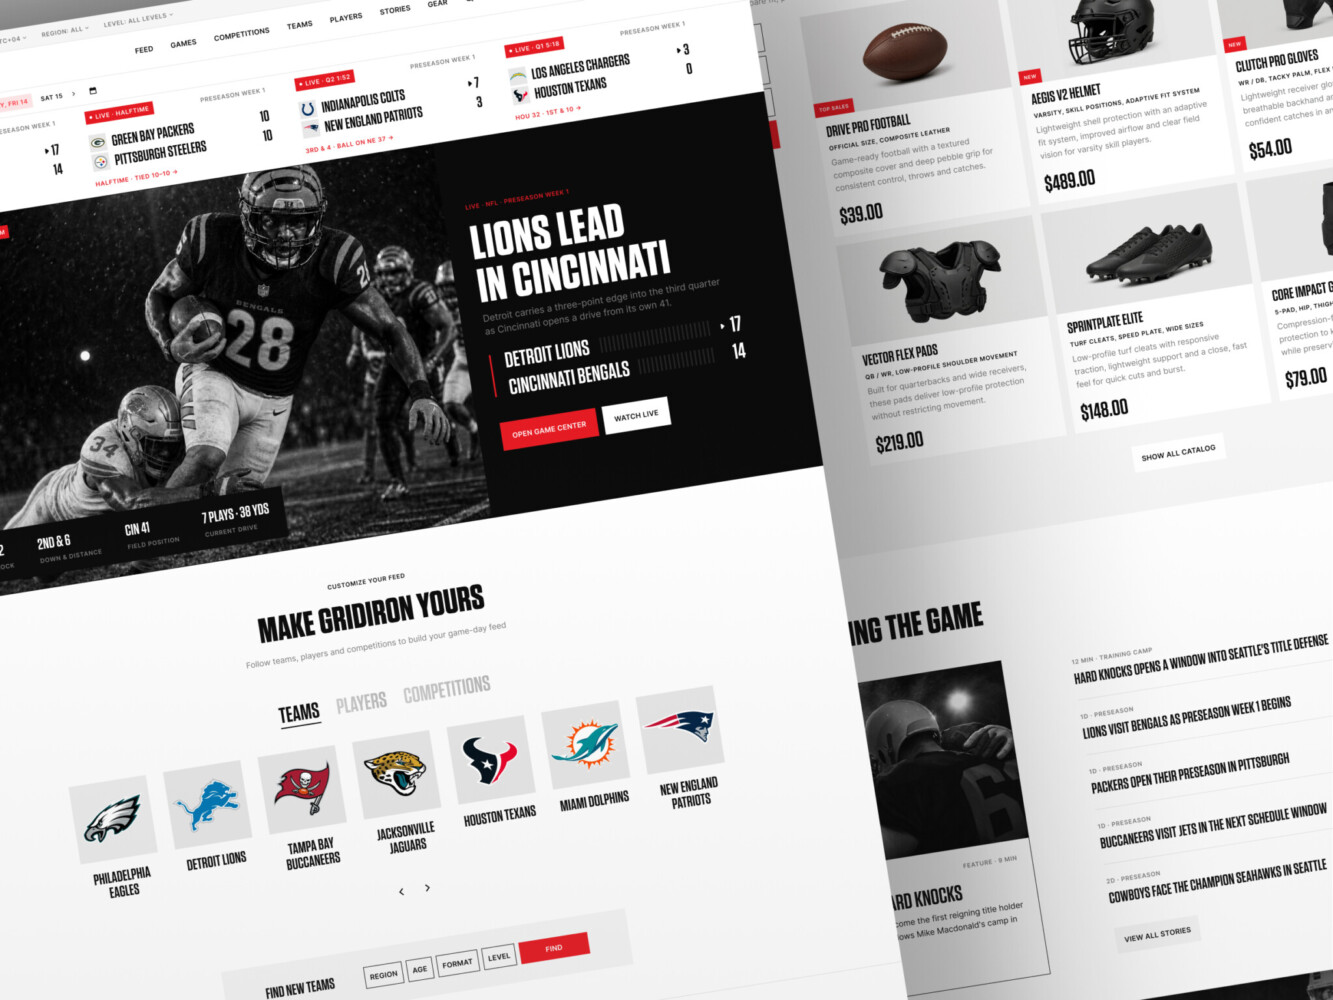
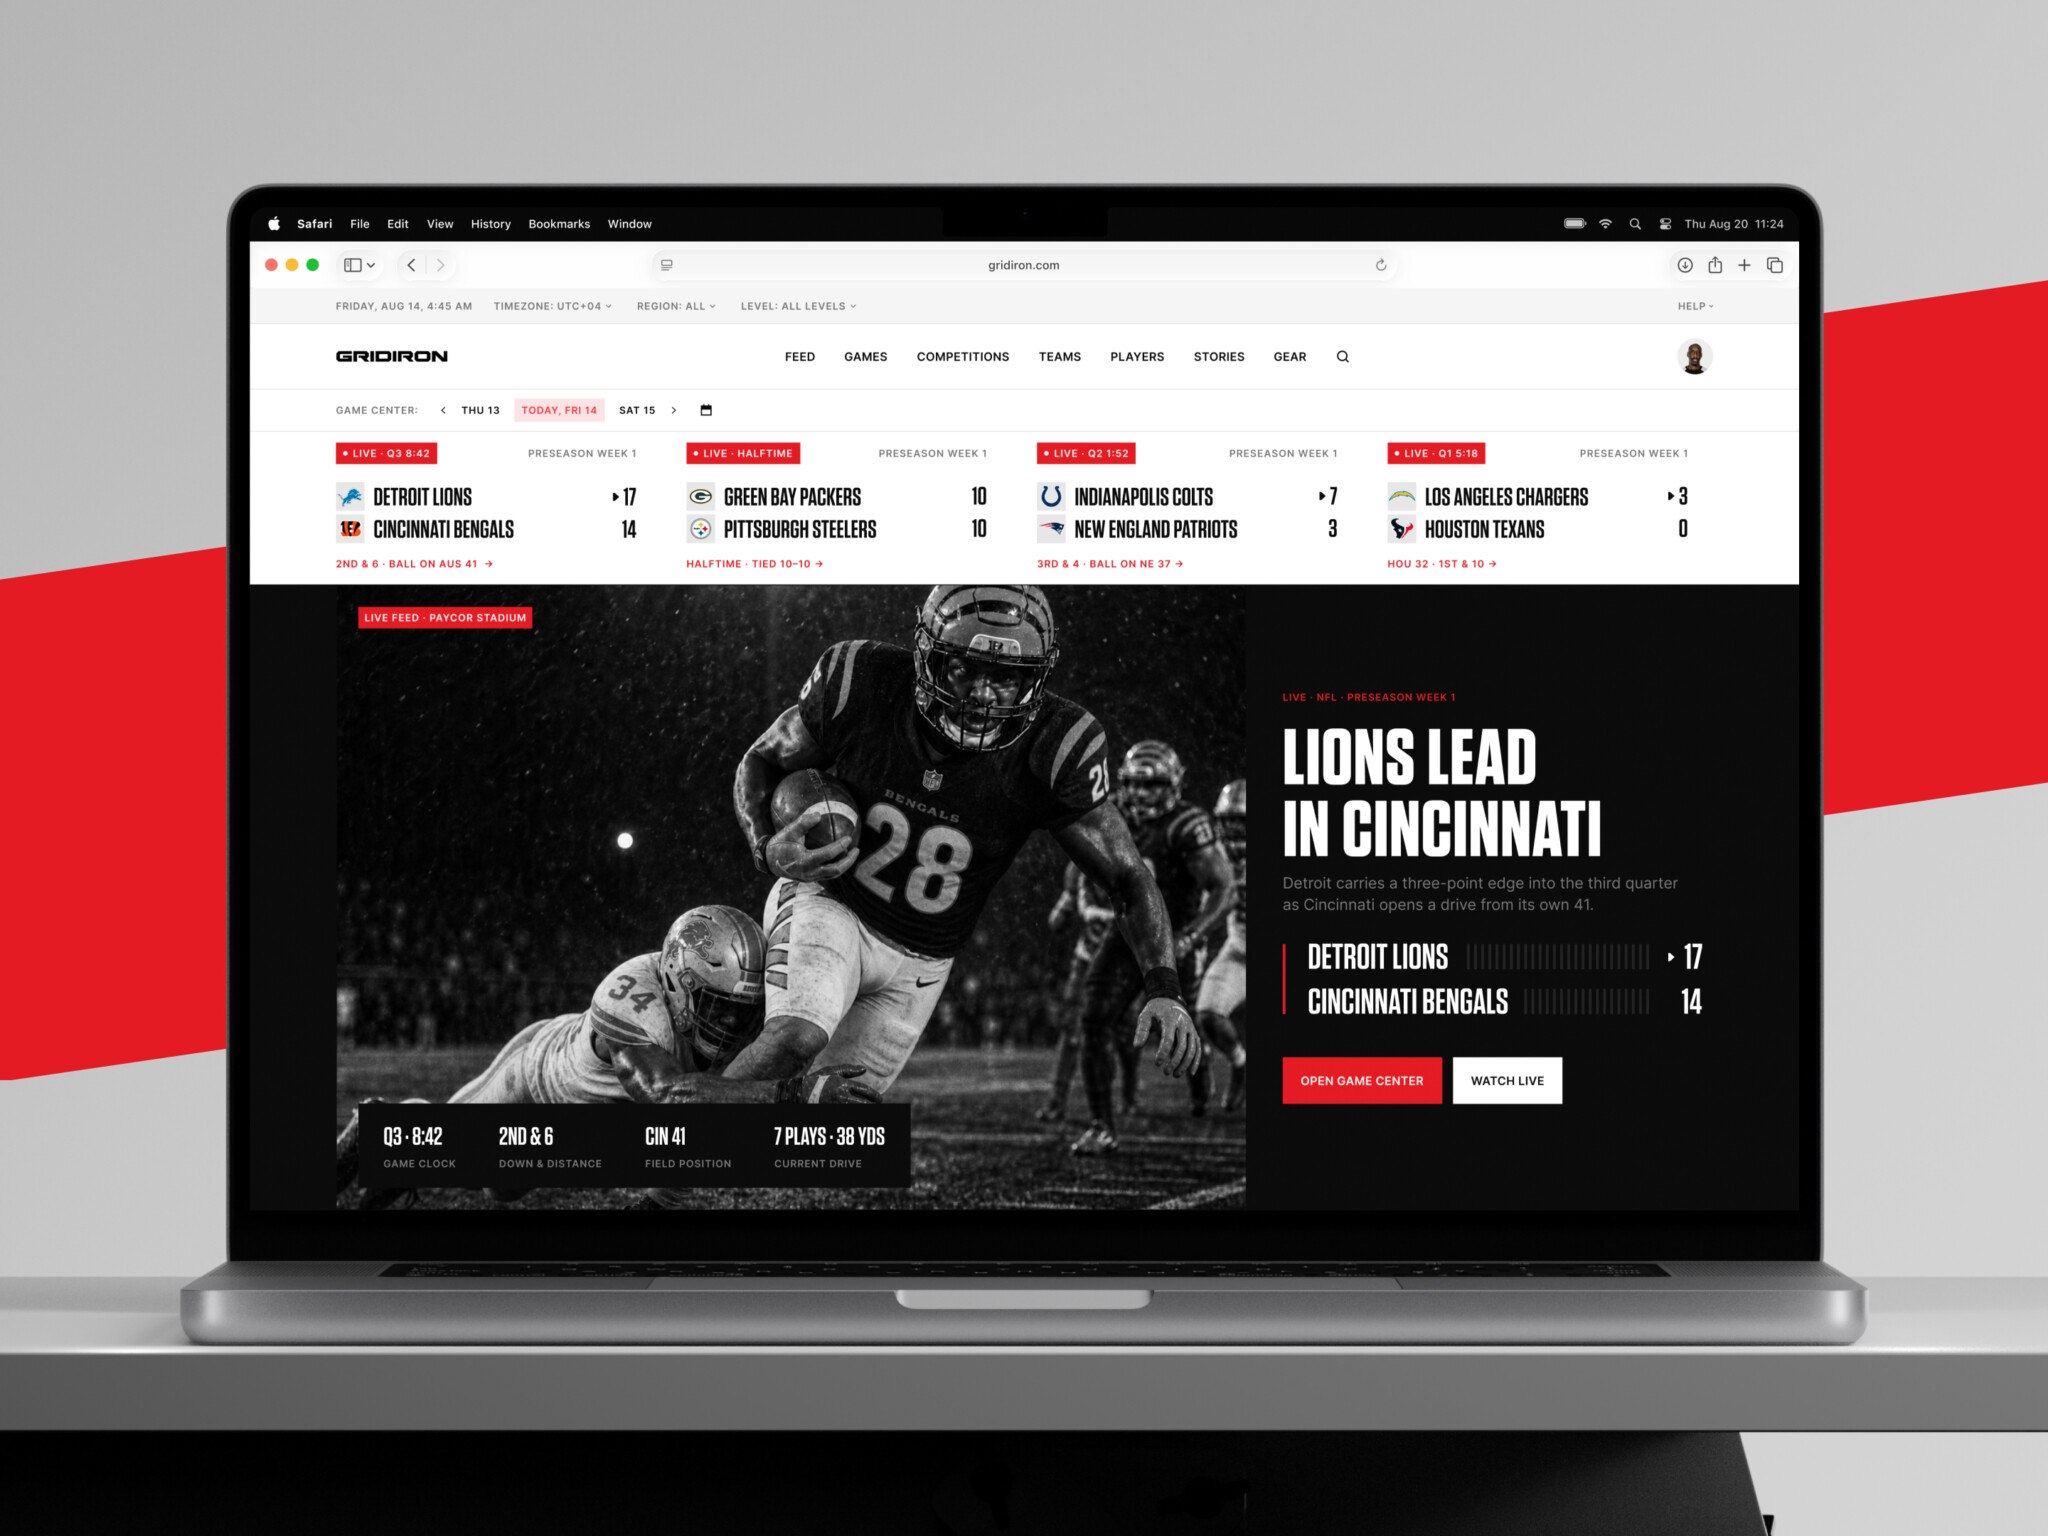
American Football Platform Design Concept by Shakuro
How Data Analytics for Sports Teams Creates Value
So, how does sports data analytics software actually create value for a team? Not just cool graphs to show the board of directors.
First off, performance tracking. This is the bread and butter. Coach dashboards have become essential here. Instead of waiting until Monday to review Friday’s practice, they see it live. If a striker’s sprint speed drops by 5% in the last ten minutes, the coach knows. Maybe he’s fatigued or he’s hiding an injury. The dashboard flags it. That’s immediate value. You can adjust the training right then and there.
Which brings us to injury prevention. Honestly, it’s probably the biggest money-saver. An ACL tear can cost a franchise millions in salary cap space alone, not to mention the ticket sales drop if your star player is out for six months. Athlete workload monitoring systems track acute vs. chronic load. Basically, are you pushing a player too hard, too fast? Teams use this to bench a player who felt “fine” but whose data showed a spike in muscular stress. Two weeks later, that same player might have torn a hamstring if he’d played. The data saved his season. Keeps the roster intact.
Opponent analysis is where things get fun. Match analysis is dissecting patterns. Let’s say you’re playing a basketball team that loves to pick-and-roll on the left side. Analytics software can pull up every instance of that play from their last ten games. Where do they shoot? Who passes? What’s their success rate? You go into the game knowing exactly what’s coming.
Recruitment is another big one for data analytics for sports teams. Scouting databases have changed the game. Used to be, scouts would fly around, watch games, write notes on napkins. Now they have massive databases with global coverage. You can filter for “left-footed defenders under 23, with high interception rates in rainy conditions.” Okay, maybe not that specific, but you get the idea. It helps find undervalued talent. It reduces the risk of bad signings. And let’s face it, bad signings hurt.
Training optimization ties back to performance, but it’s more about the long game. Data tells you what works. Maybe your strength program isn’t translating to on-field power. The analytics show a disconnect. So you tweak it. You personalize it. One player needs more mobility work; another needs explosive plyometrics. The data guides the prescription. It’s efficient. No more guesswork.
Now, let’s step off the field for a minute. Because data isn’t just for coaches. It’s for the business side, too.
Fan engagement is massive. Teams use data to understand who their fans are. What do they buy? When do they watch? Which players do they love? You can send personalized offers. “Hey, you watched every game where Player X scored. Here’s a discount on his jersey.” It feels personal. It builds loyalty.
Sponsorship insights are similar. Sponsors don’t just want their logo on a shirt anymore. They want ROI. Analytics can show them exactly how many eyes saw their brand during a broadcast or how much social media buzz their activation generated. You can prove value. That helps negotiate bigger deals.
Operational planning is the boring stuff that nobody thinks about until it goes wrong. Travel schedules. Venue management. Staffing. Data can optimize travel routes to reduce fatigue. It can predict ticket demand to adjust staffing levels at the stadium. It’s about running a tight ship. Less waste. More efficiency.
Core Features of Sports Data Analytics Software
Data Collection from Wearables, Video, Sensors
Modern sports analytics software is basically a vacuum cleaner for information. It sucks up data from everywhere. You’ve got wearables—those little GPS pods players stick in their vests, or the smart insoles that track pressure. Then there’s video. Computer vision can now track every player’s movement on the field without them wearing anything. That’s wild when you think about it.
Sensors are everywhere too. In the equipment, in the stadium, even in the balls themselves. And don’t forget the human element. Coaches still need to type things in. Maybe a subjective rating of a player’s mood or effort. Manual inputs matter because context is king.
Plus, most platforms pull from third-party APIs. Maybe you’re integrating weather data to see how rain affects passing accuracy or pulling league-wide stats for comparison. It’s a mashup. A big, messy, beautiful mashup of numbers. The best software doesn’t care where the data comes from; it just normalizes it so you can actually use it.
Real-Time Dashboards for Coaches, Analysts, Managers, and Athletes
If you hand a coach a spreadsheet with 50,000 rows during halftime, they’ll laugh at you. Or worse, they’ll ignore you.
The real-time dashboards are the face of the operation when it comes to sports analytics tools and software. But here’s the thing: one size does not fit all.
A coach needs simplicity. Big numbers. Red or green indicators. “Is he tired? Yes/No.” “Did we lose possession in the final third? Show me.” They don’t have time to dig. Analysts, though? They want depth. They want to drill down. They want to filter by time, by player, by zone. They’re okay with complexity because that’s their job. Managers and GMs look at the big picture. Trends over seasons. Contract values vs. performance metrics. They need high-level overviews.
Athletes need motivation. Simple, visual feedback on their phone. “You ran 10% more than last week. Good job.” Or, “Your recovery score is low. Take it easy.” It’s personal. It’s immediate.
Predictive Analytics and Machine Learning Models
Predictive analytics is about probability. Machine learning models look at historical data and say, “Based on these patterns, here’s what’s likely to happen.”
Take injury risk again. A model might notice that when a player’s acceleration drops slightly over three weeks, and their sleep quality dips, there’s an 80% chance of a soft tissue injury in the next ten days. That’s actionable. You can rest them. You can change their training.
Or think about game outcomes. Models can simulate thousands of match scenarios based on opponent strengths and weaknesses. It helps with strategy. “If we press high, we win 60% of the time. If we sit back, only 40%.”
Models can be biased, that’s true. They can miss intangibles like team chemistry or sheer willpower. But they give you an edge. They help you make bets with better odds.
Video Tagging, Event Tracking, and Performance Reports
Data is abstract. Video is concrete. Combining them is powerful.
Video tagging allows you to click on a stat and see the clip. “Show me all turnovers by Player X.” Ten clips pop up. You can watch them instantly. No more scrubbing through hours of footage. It saves so much time.
Event tracking automates this. The software recognizes a pass, a shot, a tackle. It logs it. It links it to the player. It builds a timeline.
Performance reports then package this up. Instead of a raw data dump, you get a narrative. “Player Y had a strong first half but faded in the second due to high defensive load.” With video evidence attached.
It makes feedback easier. Showing a player a clip of their mistake is way more effective than telling them their “defensive efficiency rating dropped.” Humans are visual creatures. We learn by seeing.
Role-Based Access, Team Permissions, and Secure Data Sharing
Sports data is sensitive. Imagine if your competitor saw your injury reports. Or your contract negotiation metrics. Disaster. So, security is built in sports analytics software from the start.
Role-based access means people only see what they need to see. The physio sees medical data. The coach sees tactical data. The intern sees nothing important.
Team permissions allow for collaboration without chaos. You can share specific datasets with specific people. Maybe you want to share scouting reports with another club for a loan deal, but keep your internal salary data private. Easy.
Secure data sharing is crucial too. Encryption. Audit logs. Knowing who accessed what and when. It’s boring admin stuff, but it protects the asset. And in pro sports, the data *is* an asset. Treat it like gold.
Custom Alerts, Benchmarks, and Exportable Reports
Finally, you need to stay on top of things. You can’t stare at dashboards 24/7.
Custom alerts are like a watchdog. “Alert me if Player Z’s heart rate exceeds 180 bpm for more than 5 minutes.” Or “Notify me when a new scouting report is uploaded.” It keeps you informed without overwhelming you.
Benchmarks give context. Is a sprint speed of 32 km/h good? Well, compared to the league average, maybe it’s great. Compared to the team record, maybe it’s average. Benchmarks help you understand where you stand.
For sports analytics tools and software, exportable reports are essential. Sometimes you need to present to the board. Or send a PDF to a player’s agent. Or just save a record for posterity. Being able to export clean, branded reports saves a ton of hassle. No more screenshots and copy-pasting into Word. Just click, download, and done.

A website for a golf club by Conceptzilla
Sports Analytics Software Architecture
So, let’s pop the hood.
If you’ve ever wondered how these sports analytics platforms actually work under the surface, it’s a bit like looking at the engine of a Formula 1 car. It’s complex, it’s loud (metaphorically), and if one tiny part fails, the whole thing grinds to a halt.
The Foundation: Data Sources and Ingestion
It all starts with the noise. You’ve got GPS trackers sending coordinates every second. Video cameras capturing 60 frames per second. Wearables measuring heart rate, acceleration, and even sweat composition. Plus manual inputs from coaches and third-party APIs pulling in league stats or weather data.
This is the messy part. The ingestion layer has to handle all of this. Different formats, different speeds, different reliability levels. Some sensors drop packets. Video feeds lag. The ingestion layer is like a bouncer at a club, deciding what gets in and cleaning it up before it hits the main floor. It normalizes the data. Timestamps everything. Makes sure that when the GPS says “Player A is here,” the video frame agrees.
If this layer is weak, everything else is garbage.
The Brain: Database, Warehouse, and Analytics Engine
Once the data is in, where does it go? Well, it depends on what you need.
For raw, high-frequency tracking data—like those millisecond-by-millisecond GPS points—you need a time-series database. Something fast. Something that can write millions of records an hour without choking. Traditional SQL databases just can’t handle that volume efficiently.
But for historical analysis, player profiles, and contract info, you want a data warehouse. This is where you store the “truth” about your players over years.
The analytics engine is the processor. It takes the raw data and crunches it. It calculates distance run, speed zones, pass completion rates, expected goals (xG), whatever metric your sport uses. It turns raw numbers into meaningful stats.
The Magic: ML Models and Backend APIs
Now, add the smart stuff. Machine learning models sit on top of the processed data. They’re not always running in real-time—sometimes they batch process overnight—but they’re crucial for predictions. Injury risk, performance trends, opponent tendencies, etc.
These models feed into the backend APIs. Think of APIs as the waiters in a restaurant. The frontend (what the user sees) asks for data. The API goes to the kitchen (the database/engine), gets the right dish, and brings it back. Securely.
If the API is slow, the dashboard feels sluggish. And in sports, slowness is unacceptable. Coaches want answers now. So optimizing these APIs is a constant battle.
The Face: Frontend Dashboard and Admin Panel
This is what people actually see. The frontend dashboard. It’s built with modern frameworks—React, Vue, Angular—whoever the team prefers. It needs to be responsive, interactive, and visual.
Charts that update in real-time. Video players that sync with stats. Maps of the field showing player positions. It has to look good and work smoothly on tablets, laptops, and even phones.
The tech team needs admin panels for managing users, setting permissions, and configuring data sources. It’s not pretty, but it’s necessary for sports data analytics software. You need control over who sees what. Especially when you’re dealing with sensitive medical or contract data.
The Skeleton: Cloud Infrastructure, Monitoring, and Security
Most of this runs on the cloud, for example, AWS, Azure, Google Cloud, because of scalability.
Imagine it’s game day. Suddenly, you have ten times the normal data flow. Video streams are live. Sensors are pumping data. If you’re running on a single server in a closet, you’re dead. Cloud infrastructure lets you scale up instantly. Add more computing power when you need it, scale down when you don’t. Save money. Stay alive.
Monitoring is key too. You need to know if a sensor stops sending data. If the API latency spikes. If the database is running out of space. Automated alerts keep the engineers awake at night (unfortunately).
And security should be everywhere. Encryption at rest, encryption in transit. Role-based access control. Audit logs. You’re protecting intellectual property. Player privacy. Competitive advantage. One leak could cost a team millions. So it’s taken seriously.
Scaling for the Real World
Here’s the tricky part. Many platforms serve multiple teams. Maybe even multiple leagues.
You need multi-tenancy. Each team’s data must be completely isolated. Team A can never see Team B’s data. Ever. The architecture has to enforce this strictly.
And seasons change. Data accumulates. You’re storing years of high-frequency tracking data. That’s petabytes. The storage architecture needs to be cheap for old data, fast for new data. Tiered storage helps.
High-frequency tracking is the beast. Soccer balls move fast. Basketball players change direction instantly. Capturing that requires serious bandwidth and processing power. If you miss a few seconds, you lose context. The system has to be robust enough to handle bursts of data without dropping packets.
AJP website by Shakuro
Development Process for Sports Analytics Software
1. Discovery and Product Strategy
Before you write a single line of code, you need to know who you’re building for.
Are you building for a high-school coach with an iPad and no budget? Or a Premier League analytics department with twenty PhDs? The needs are wildly different. One wants simplicity; the other wants depth.
This is where most founders mess up. They build what they think is cool, not what the user actually needs. So, talk to coaches. Sit in on film sessions. Find the pain points. Is it too much data? Not enough? Hard to share?
Define your value proposition clearly. Are you saving time? Preventing injuries? Finding hidden talent? Pick one or two things and do them incredibly well. Don’t try to boil the ocean.
2. Data Source Mapping and Analytics Requirements
Once you know the “why,” you need to figure out the “what.” Specifically, the data.
Where is it coming from? GPS vests? Optical tracking cameras? Manual stats sheets? Third-party APIs like StatsPerform or Sportradar? You need to map every single source. What format is it in? How often does it update? Is it reliable?
Then, define the analytics. What metrics actually matter? Don’t just copy what everyone else does. If you’re building for basketball, maybe “points per possession” is standard, but what about “defensive disruption score”? Define the formulas. Get buy-in from subject matter experts. If your math is wrong, your product is worthless.
3. UX/UI Design for Coaches, Analysts, and Administrators
Coaches are busy. They’re stressed. They’re standing on a sideline in the rain. They don’t have time to click through five menus to find a player’s heart rate. The UI needs to be intuitive. Big buttons. Clear visuals. High contrast.
Analysts, on the other hand, want density. They want to see everything at once. They love filters, drill-downs, and custom views.
Administrators need control. User management. Billing. Settings.
You can’t design one interface for all three. You need role-based views. Many designs fail because they tried to make one dashboard do everything. It ended up cluttered and confusing. Keep it separate. Keep it focused.
When designing sports data analytics software, test it with real users. Not your friends. Real coaches. Watch them struggle. It’s painful, but it’s the best feedback you’ll get.
4. Architecture and Tech Stack Planning
You need a stack that can handle scale. Cloud-native is usually the way to go. AWS, Azure, GCP. You need flexibility.
Choose your databases wisely. Time-series for sensor data. Relational for user info. Maybe a data lake for raw video. Think about microservices vs. monolith. For a startup, a modular monolith might be faster. But if you plan to scale to multiple leagues, microservices might save you later.
Security is non-negotiable. Plan for encryption, access control, and compliance (GDPR, HIPAA if you’re touching medical data). Don’t bolt it on later. Build it in.
5. MVP Development
Don’t build the Ferrari first. Build the skateboard.
Your Minimum Viable Product should do one thing really well. Maybe it’s just ingesting GPS data and showing a simple load report. That’s it. No video. No AI. Just clean, accurate data visualization.
Get it into the hands of users quickly. Let them break it. Let them tell you what’s missing.
Many teams spend a year building a “complete” platform, only to launch and realize nobody wants half of the features. Start small. Iterate fast.
6. API Integrations and Data Pipelines
This is where the rubber meets the road. Your MVP is useless if it can’t get data.
Build robust pipelines. Handle errors gracefully. If a sensor disconnects, does the system crash? Or does it just flag a gap in data?
Integrate with common providers. Make it easy for teams to plug in their existing tools. The easier it is to onboard, the faster you’ll grow.
And document your APIs. If you want third-party devs to build on your platform, you need clear, clean docs. Otherwise, you’re stuck doing all the work yourself.
7. Testing, Validation, and Model Accuracy Checks
Testing in sports is hard. You can’t just run unit tests. You need domain validation.
Does the “fatigue score” actually correlate with player performance? You need to check. Compare your models against historical outcomes. If your injury prediction model says a player is at risk, did they actually get injured? If not, why?
Involve experts in sports analytics software development. Have coaches review the outputs. Do they make sense? If a model says a player ran 20km in a 90-minute game, something is wrong. Catch those edge cases.
Beta test with a friendly team. Let them use it in real games. The pressure will reveal bugs you never saw in the lab.
8. Deployment, Scaling, and Long-Term Support
Launch day is exciting. But it’s just the beginning.
Monitor everything: performance, errors, user engagement, etc. Be ready to scale up if a big team signs on. Cloud auto-scaling helps, but you still need to watch costs.
Support is key. Coaches will have questions. Analysts will find bugs. Respond quickly. Build trust.
And keep iterating. Sports change. Rules change. Technology changes. Your platform needs to evolve. Listen to your users. Add features they actually ask for.

Golf club website by Conceptzilla

Tech Stack for Sports Analytics Software Development
Choosing a tech stack for sports analytics is a bit like picking a starting lineup. You can’t just pick the most famous players; you need them to work together. And you need them to handle pressure.
Frontend: Where the Magic Happens
This is what the coaches and analysts see. If it’s slow or ugly, they won’t use it. Period.
React is the go-to here. It’s flexible, has a huge ecosystem, and component-based architecture makes it easy to build complex dashboards. You can reuse a “player card” component across different views. Saves time.
Sometimes you’ll see Vue or Angular, but React dominates for a reason. For data-heavy visualizations, you’ll likely pair it with libraries like D3.js or Chart.js. But honestly, for quick wins, tools like Recharts or Visx are easier to integrate with React.
The key is responsiveness. Coaches use tablets on the sideline. Analysts use wide monitors in the office. The frontend needs to adapt.
Backend: The Engine Room
This is where the logic lives. Processing requests, handling auth, managing business rules.
Node.js is popular because it’s fast for I/O-heavy tasks. Think about handling thousands of sensor updates per second. Node’s non-blocking nature helps. Plus, if your frontend team knows JavaScript, they can help with the backend. That’s a win for small teams.
But don’t sleep on Python. Especially if you’re doing heavy data processing or ML. FastAPI or Django are great choices. Python is the language of data science, so having it in the backend makes integrating models smoother. No need to translate logic between languages.
Often, you’ll see a mix. Node for the real-time API, Python for the heavy lifting. Microservices architecture allows this.
Cloud Infrastructure: The Foundation
You’re not hosting this on a server in your garage. You need scale.
Pick one of the popular providers, for example, AWS, Azure, or GCP. They all offer similar services: compute, storage, and networking. AWS has the biggest market share, so finding devs who know it is easier. Azure is strong if you’re dealing with enterprise clients (like big leagues) who already use Microsoft tools. GCP is great for data and ML.
Use serverless functions (like AWS Lambda) for sporadic tasks. Use containers (Docker/Kubernetes) for your main services. It makes deployment consistent.
Databases: Storing the Truth
One database doesn’t fit all. You need a polyglot persistence strategy.
PostgreSQL is the workhorse. Reliable, ACID-compliant, great for user data, team info, match results. It’s the safe bet.
But for tracking data? Those GPS points coming in every 100ms? Postgres will choke. You need a time-series database like InfluxDB or TimescaleDB. They’re optimized for writing and querying temporal data.
For historical analysis, a data warehouse like Snowflake or BigQuery is a must. You dump raw data here, clean it, and run complex queries without slowing down your app. It’s separate from your operational DB. Smart move.
Analytics and ML: The Brain
This is where Python shines with Pandas and NumPy for data manipulation. Essential.
For machine learning, Scikit-learn is great for traditional models (regression, classification). For deeper stuff, TensorFlow or PyTorch. PyTorch is getting more love lately because it’s more pythonic and easier to debug.
Don’t forget Jupyter Notebooks for experimentation. Analysts love them. They can test ideas before you code them into the product.
Visualization and BI: Making Sense of It
Sometimes you don’t need custom charts. You need quick insights.
Embedding BI tools like Tableau or Power BI can save months of development. They connect directly to your data warehouse. Great for internal reports or for clients who want to build their own dashboards.
But for in-app visuals, stick to JS libraries. Highcharts is robust. Plotly is interactive. Choose based on your design needs.
Mobile: On the Go
Coaches live on their iPads. Players check stats on phones.
React Native or Flutter allow you to build iOS and Android apps with one codebase. Efficient.
If you need high-performance graphics (like 3D player tracking), you might need native Swift or Kotlin. But for most stats and alerts, cross-platform is fine.
API Layer: The Glue
Your APIs need to be fast and documented.
REST is standard. But for real-time updates (like live game stats), GraphQL or WebSockets are better. GraphQL lets the frontend ask for exactly what it needs. No over-fetching. WebSockets push data instantly.
Use Swagger or OpenAPI for docs. If other teams want to integrate with you, good docs are your best sales tool.
Putting It Together
So, a typical stack for creating sports data analytics software might look like this:
- Frontend: React + TypeScript
- Backend: Node.js (Express/NestJS) + Python (FastAPI)
- Cloud: AWS (EC2, S3, Lambda)
- DB: PostgreSQL + InfluxDB
- Warehouse: Snowflake
- ML: Python (PyTorch, Scikit-learn)
- Mobile: React Native
- API: REST + WebSockets
It’s not cheap. But it’s robust.
You know, the tech is just the tool. The value comes from how you use it. But if the tool breaks during the playoffs? You’re in trouble. So choose wisely. Build it strong.
Common Challenges in Building Sports Analytics Software
Here are the challenges that keep people up at night. And no, they’re not easy fixes.
Messy Data and Inconsistent Tracking Formats
Every league has different standards. Every sensor manufacturer uses different formats. One GPS provider outputs latitude/longitude in one format; another uses local coordinates. Video tracking systems from Company A don’t talk to Company B.
So, you spend half your engineering time just cleaning data and normalizing it. Mapping “Player ID 123” in one system to “John Doe” in another. It’s tedious. But if you get it wrong, your whole platform is garbage.
Sensor Accuracy and Real-World Noise
Sensors drift. They lose signal. Batteries die.
GPS struggles in stadiums with heavy roofs. Optical tracking gets confused when players overlap. Wearables slip during tackles.
You have to build algorithms that account for noise. Filter out the outliers. But how do you know what’s an outlier and what’s a genuinely incredible play? It’s a constant battle between smoothing the data and keeping the truth.
Real-time processing is a beast. Ingesting thousands of data points per second, processing them, and displaying them with sub-second latency is hard. Network lag, server load, browser rendering—it all adds up. If your dashboard shows a goal ten seconds after it happens, the coach is going to throw the iPad.
Privacy and Athlete Health Data Security
You’re dealing with biometric data. Heart rates. Sleep patterns. Injury histories. Maybe even mental health metrics.
That’s sensitive. Really sensitive. GDPR in Europe, HIPAA in the US, various other laws globally. You can’t just store this anywhere. You need encryption. Strict access controls. Audit logs.
And athletes are wary. Rightfully so. If a team knows a player has a chronic issue, does that affect their contract? Their playing time? Trust is fragile. One leak, one misuse of data, and you’re done. Teams will drop you. Players will refuse to wear the sensors.
Dashboard Complexity and User Adoption
Here’s a paradox: the more data you have, the harder it is to make it useful.
Analysts love complexity. They want every metric, every filter, every drill-down. Coaches hate it. They want one number. One color. One answer.
Balancing these needs is tough. If you make the dashboard too simple, the analysts revolt. Too complex, and the coaches ignore it.
Onboarding is key. Training is key. But ultimately, the UX has to be intuitive. If it takes more than three clicks to find the info you need during a game, it’s broken.
Integration Cost and Legacy Systems
Sports teams are not tech startups. They’re often old institutions with legacy systems. Spreadsheets from 2010. Old video servers. Proprietary scouting databases.
Integrating your shiny new sports analytics tools and software with their old junk is expensive. Time-consuming. Painful.
You might need to build custom connectors. Hire consultants. Spend months just getting data to flow. And the team’s IT staff? They’re probably overwhelmed already. You’re asking them to change their workflow. That’s resistance.
Budgets get blown on integration alone. It’s rarely as simple as “plug and play.”
Model Explainability and Trust
Machine learning is great. But it’s a black box. If your model says a player is at high risk of injury, the coach will ask: “Why?”
If you can’t explain it, they won’t trust it. “The algorithm said so” isn’t an answer. You need explainable AI. Show the factors. “His acceleration dropped 10% last week. His sleep score was low. His load increased.”
But even then, intuition fights back. Coaches have years of experience. They trust their gut. If the data contradicts their gut, they’ll doubt the data.
Building models that are not just accurate but believable is a huge challenge. It requires transparency. It requires collaboration with domain experts.
The Human Factor
At the end of the day, sports are played by humans. For humans.
Technology is just a tool. It can’t replace leadership. It can’t replace chemistry. It can’t replace heart.
The biggest challenge isn’t technical. It’s cultural. Getting people to embrace data. To change how they work. To trust the numbers.

Greensward website by Shakuro
How Much Does Sports Analytics Software Cost?
Let’s talk money. Because honestly, this is usually the first question I get, and it’s also the hardest to answer with a straight face. “It depends” is the most annoying phrase in tech, but with sports analytics, it is basically the only honest starting point.
MVP: Getting Your Foot in the Door
Rough Range: $40k – $120k
This is your skateboard. Maybe a simple web app that ingests one data source (say, GPS vests) and shows basic load metrics and heat maps. No video sync. No AI. Just clean, reliable data visualization for one team or a small league.
At this level, you’re proving the concept. You’re using off-the-shelf components where possible. Maybe a template dashboard. Basic PostgreSQL database. Minimal backend logic.
The cost here is mostly about speed. Can you get something usable in 3-4 months? If yes, you’re in this tier. If you start adding “just one more feature,” you’re already creeping up.
Mid-Level Analytics Platform: Serious Business
Rough Range: $150k – $500k
Now we’re talking. This is for regional leagues, college programs, or growing pro teams. You’ve got multiple data sources integrated (wearables + video + manual stats). Real-time dashboards for coaches and analysts. Role-based access. Maybe a mobile app for players. Basic predictive models (like fatigue alerts).
This tier requires real architecture. Time-series databases. Proper API design. Cloud infrastructure that can handle game-day spikes. UX/UI that’s been tested with actual users.
You’re probably hiring a small, dedicated team or a specialized agency. Timeline? 6-9 months minimum. And don’t forget ongoing maintenance. This isn’t a one-and-done project.
Enterprise-Grade System: The Big Leagues
Rough Range: $750k – $3M+
Welcome to the deep end. Multi-league support. Petabytes of historical data. Advanced ML models for injury prediction, opponent analysis, and recruitment scoring. Full video tagging and sync. Custom admin panels. SOC2/HIPAA compliance. White-label options. Dedicated DevOps. 24/7 monitoring.
This is a full-scale software product. You’re building infrastructure that rivals tech companies. Teams at this level often have in-house engineering squads working year-round. Or they partner with top-tier vendors who charge premium rates because, well, failure isn’t an option.
Timeline? A year or more. And the operational costs (cloud, licenses, support) can easily match or exceed dev costs annually.
What Actually Drives the Price Up?
Okay, so why such huge gaps? Here’s what moves the needle:
- Integrations: Every new data source adds complexity. Proprietary APIs? Legacy systems? Custom hardware? Each one is a mini-project. Three integrations might cost as much as the core platform.
- Data Volume & Velocity: Handling 100 GPS points per second for 30 players is different than processing daily summary stats. High-frequency data needs specialized databases, streaming pipelines, and serious cloud compute. Storage costs add up fast.
- ML Complexity: A simple regression model? Cheap. A neural network that predicts ACL tears with 85% accuracy using multimodal data? Expensive. You need data scientists, labeled datasets, validation frameworks, and explainability layers. ML isn’t just code; it’s research.
- Mobile Apps: Native iOS/Android development doubles your frontend effort. Cross-platform helps, but testing across devices, OS versions, and offline scenarios still eats budget. Coaches want tablets. Players want phones. Admins want desktop. Three experiences to maintain.
- Real-Time Processing: Sub-second latency requires WebSockets, edge computing, optimized queries. Buffering is unacceptable during live games. This demands architectural decisions that cost more upfront but prevent disasters later.
- Compliance & Security: HIPAA? GDPR? SOC2? Each certification adds audits, legal reviews, encryption overhead, and documentation. Skipping this might save money now, but losing a client over a breach will cost far more.
- Custom Dashboards: Off-the-shelf BI tools are cheap. Bespoke visualizations tailored to a coach’s mental model? That’s design + frontend + iteration cycles. The more unique the view, the higher the cost.

Custom Development vs. Ready-Made Sports Analytics Tools and Software
This is the classic dilemma, isn’t it? Buy or build. Let’s break it down, because the differences are stark.
Ready-Made Tools: The Quick Fix
Off-the-shelf software—things like Catapult, Hudl, StatsPerform, or even simpler SaaS platforms—is like buying a house that’s already been built. You can move in tomorrow. The plumbing works. The roof doesn’t leak. But you can’t knock down a wall without asking permission. And if you don’t like the kitchen layout? Too bad.
When is this enough?
Honestly, for 80% of teams, ready-made tools are perfectly fine. Maybe even ideal.
If you’re a high school, a small college, or a lower-league pro team, you probably don’t need a custom platform. You need reliable data. You need to track load. You need to watch video. These tools do that well. They’ve been tested by thousands of users. Bugs get fixed quickly. Support is there.
The cost is predictable. You pay a subscription. No surprise engineering bills. No hiring a DevOps team.
The downsides?
You’re stuck with their roadmap. If they decide to remove a feature you love, tough luck. If you want to combine their GPS data with your own proprietary scouting notes in a specific way, you might hit a wall. Integration can be clunky. And you’re never truly unique. Your competitors have the same tool. The same metrics. The same views.
Custom Development: The Tailored Suit
Building your own platform is like commissioning a bespoke suit. It fits perfectly. It’s made from the exact fabric you want. But it takes months. It costs a fortune. And if you gain weight, you need a new one.
When is this better?
Custom makes sense when off-the-shelf just doesn’t cut it. And that usually happens at the elite level.
- Unique Workflows: Every team has its own culture. Maybe your coaches review film in a specific order. Maybe your medical staff uses a weird checklist. Ready-made tools force you to adapt to their workflow. Custom tools adapt to yours. That efficiency gain? It’s huge.
- Proprietary Models: This is the big one. If you’ve developed a secret sauce—a unique algorithm for predicting player fatigue or identifying undervalued recruits—you can’t put that into a generic tool. You need your own infrastructure to protect and run that IP. It’s your competitive advantage. You don’t share it.
- Multiple Data Sources: Let’s say you use three different wearable brands, two video providers, and a custom internal scouting app. Getting them all to talk to each other in a ready-made tool is a nightmare of CSV exports and manual imports. A custom platform can ingest all of them natively. One source of truth. Clean. Automated.
- Branded SaaS: Maybe you’re not a team. Maybe you’re a consultancy or a league wanting to offer analytics to your members. You want your logo, your colors, your domain. White-labeling ready-made tools is often expensive and limited. Building your own lets you control the entire brand experience.
- Team-Specific Analytics: Standard metrics (distance run, sprints) are fine. But what if you want to measure “pressure applied per possession in the final third” specifically for your tactical system? Generic tools won’t have that. Custom lets you define your own language.
The downsides?
It’s expensive. Really expensive. And it’s never “done.” You need a team to maintain it. Update it. Fix bugs. Security patches. Server costs. If your lead developer quits, you’re in trouble. It’s a long-term commitment.
So, How Do You Choose?
Ask yourself these questions:
- Is our problem unique? If yes, lean custom. If no, buy.
- Do we have technical talent in-house? If no, buying is safer.
- Is this data our competitive edge? If yes, you might need custom to protect it.
- What’s our budget? Be honest. If it’s tight, buy. Don’t gamble.
You know, sometimes the best approach is hybrid. Use ready-made tools for the standard stuff (GPS, video) and build a lightweight custom layer on top to integrate them and add your proprietary insights. Best of both worlds. Well, sort of. It still requires integration work, but it’s cheaper than building everything from scratch.

Branding for Emerill by Shakuro
When to Use Sports Analytics Software Development Services
Look, there comes a point in every sports organization’s journey where the spreadsheets stop working. You’re drowning in CSV files, your GPS data doesn’t match your video timestamps, and your coach is asking for a metric that no off-the-shelf tool provides.
That’s usually when people start thinking about custom software. But here’s the thing: building it yourself is risky. You need engineers who understand data pipelines, designers who get that a coach on a sideline has three seconds to read a screen, and architects who can handle the load of a live championship game.
This is where partnering with a specialized development agency makes sense. It’s about bringing in a team that’s done this before.
When You Need Custom Architecture
Off-the-shelf tools are rigid. If your team has a unique way of tracking performance—maybe you combine biometric data with tactical positioning in a way nobody else does—you need a foundation built for that. We design architectures that aren’t just functional but flexible, planning for scale from day one. So when you go from tracking one team to ten, or from one league to three, the system doesn’t collapse.
UX Design That Actually Works
Bad UX kills analytics platforms. If a dashboard is cluttered or confusing, coaches will ignore it. They’ll go back to their gut feelings. We put a heavy emphasis on user-centric design. We understand that a coach needs clarity, not complexity. That’s why our designers create interfaces that highlight what matters right now. It sounds simple, but getting it right requires serious design expertise.
So, Is It Right for You?
If you’re a small club with basic needs, maybe not. Stick to ready-made tools. But if you’re a pro franchise, a league, or a tech-forward sports brand looking to create a proprietary advantage? Then yes.
You need more than just software. You need a strategic partner. Someone who understands the intersection of sports, data, and technology. Shakuro offers that blend of technical depth and product thinking.
It’s an investment, sure. But think about the cost of not doing it. The missed insights. The preventable injuries. The inefficient workflows. Sometimes, paying for expertise upfront saves you a fortune in headaches later.
Final Thoughts
So, where does that leave us? If you take one thing away from all this, let it be this: sports analytics software isn’t just a dashboard. It’s not a collection of pretty charts to impress the board or a fancy way to store GPS data. It’s a decision-making system.
That’s a subtle difference, but it changes everything. A dashboard shows you what happened. A decision-making system tells you what to do about it. And building that requires more than just code. It requires a deep respect for data quality—because garbage in really does mean garbage out. It demands obsessive attention to usability—because if a coach can’t understand it in three seconds, it’s useless. It needs a rock-solid architecture that won’t buckle under the pressure of live game data. And above all, it has to align with your actual business goals. Are you trying to win championships? Sell more tickets? Keep players healthy? The tech has to serve those goals, not the other way around.
Many projects fail because they focused on the “tech” and forgot the “sports.” They built complex models nobody trusted. They created interfaces that were beautiful but confusing. They ignored the messy reality of human performance.
Don’t make that mistake.
Think about your unique edge. What do you know that your competitors don’t? How can technology amplify that? Is it a proprietary scouting algorithm? A unique way of tracking recovery? A seamless link between medical staff and coaches?
That’s where custom development shines. It turns data into a competitive advantage that you actually own.
So, if you’re sitting there thinking, “We have all this data, but we’re not really using it,” or “Our current tools are holding us back,” maybe it’s time to have a real conversation.
Let’s talk about what a custom sports analytics product could look like for your specific needs.
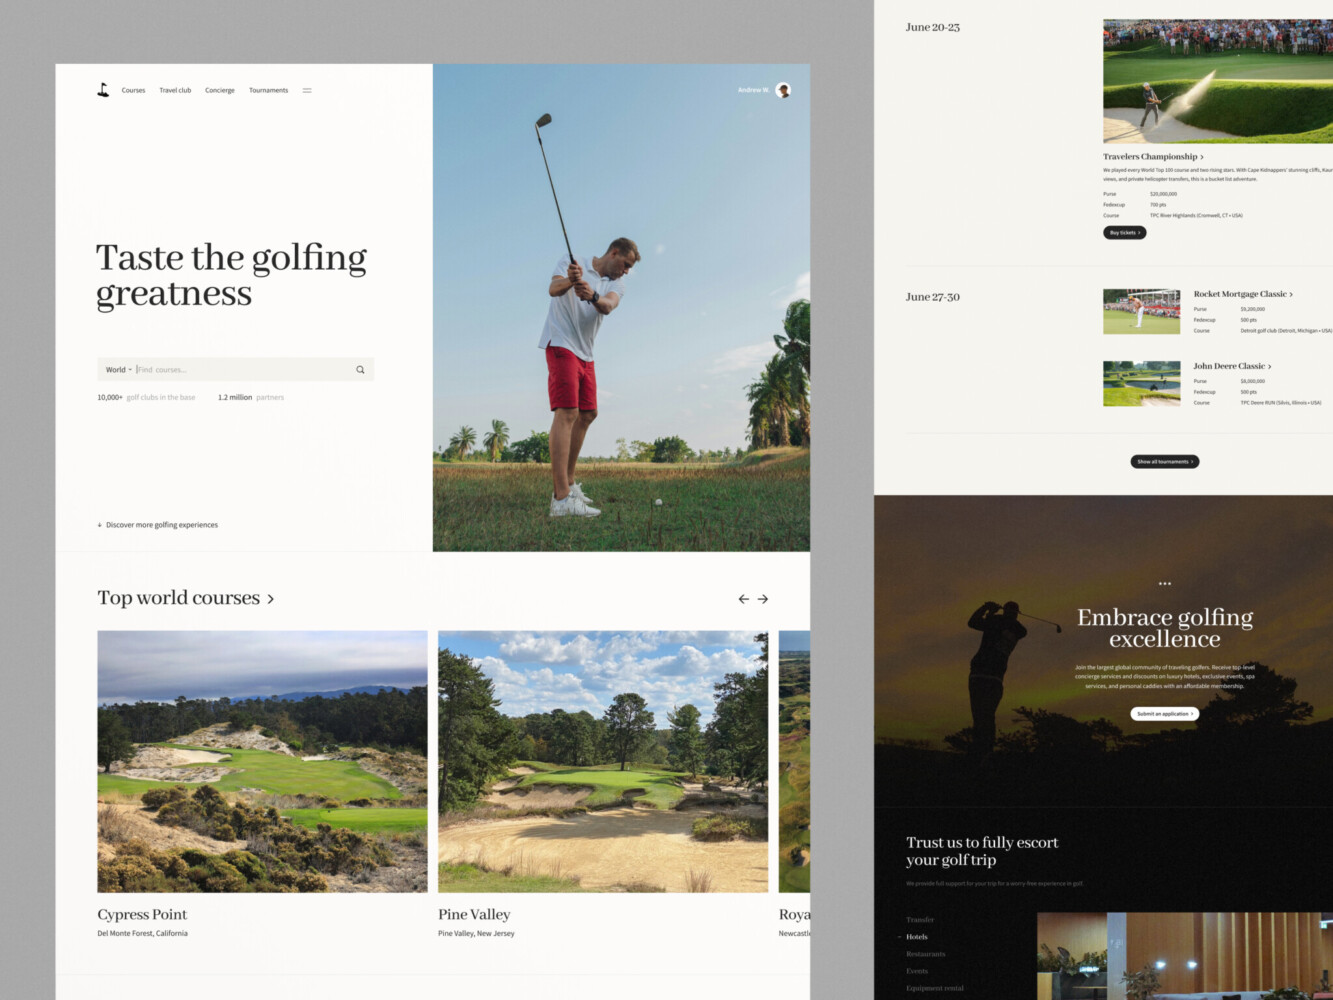
Golf Website Design Concept by Shakuro
FAQ
What is sports analytics software?
Sports analytics software is a digital system that collects and analyzes sports data from wearables, video, sensors, and manual stats, then turns it into reports, dashboards, alerts, or predictions. Teams use it to track performance, reduce injury risks, study opponents, improve scouting, and make decisions without digging through spreadsheets. It can be a ready-made tool or a custom platform built around a team’s own workflows.
Who needs sports data analytics software?
Clubs, leagues, sports tech startups, academies, fitness platforms, and media companies. If your organization works with player stats, match data, wearable data, video analysis, or fan behavior, a dedicated analytics platform makes that data easier to use. Small clubs with standard needs usually do fine with ready-made tools; pro franchises and leagues more often need custom systems.
What features should sports analytics software include?
Most sports analytics products need data collection from wearables, video, and sensors, real-time dashboards for coaches, analysts, and managers, reports, role-based access and secure data sharing, integrations, and custom alerts and benchmarks. More advanced systems add predictive analytics and machine learning models, video tagging and event tracking, and AI-based insights. Start with the features your coaches will actually read under time pressure.
How much does sports analytics software development cost?
An MVP with one data source and basic load metrics costs roughly $40k–$120k. A mid-level platform with multiple integrated sources, real-time dashboards, role-based access, and basic predictive models costs $150k–$500k. An enterprise-grade system with advanced ML, full video sync, and SOC2/HIPAA compliance runs $750k–$3M+. Integrations, data volume, ML complexity, mobile apps, and real-time processing drive the price.
How long does it take to build sports analytics software?
A sports analytics MVP that proves the concept usually takes about 3–4 months. A mid-level platform for regional leagues, college programs, or growing pro teams takes 6–9 months minimum, and an enterprise-grade system takes a year or more. Each new data source, real-time requirement, or ML model extends the timeline, and every tier needs ongoing maintenance after launch.
Should we use ready-made tools or build custom sports analytics software?
For 80% of teams, ready-made tools like Catapult, Hudl, or StatsPerform are perfectly fine: they are fast to adopt and the cost is predictable. Custom development makes sense when you have unique workflows, proprietary models to protect, several data sources to combine, or plans for a branded analytics product. A hybrid approach, ready-made tools plus a lightweight custom layer, is also common.
Related reading
- SaaS Analytics Platform Development: How to Build Scalable Data-Driven SaaS Products
- AI Analytics Platform Development: How to Build Intelligent Data Analytics Systems
- Predictive Analytics Systems: How to Build Software That Turns Data Into Decisions
- Data Analytics for eLearning Platforms: How to Build Data-Driven EdTech Systems