
Data warehouse development is the process of building a central system that collects data from different tools, cleans and organizes it, and makes it ready for reporting, BI dashboards, forecasting, and analytics. In practice, it means connecting sources like product databases, CRMs, payment systems, and marketing tools, then creating reliable pipelines, models, metrics, and access rules so teams can trust the numbers they use.
Contents:
Quick Facts
| Question | Short Answer |
| Best for | SaaS, fintech, healthcare, marketplaces, analytics-heavy products |
| Typical timeline | 2-6 months depending on sources and complexity |
| Core components | Data sources, ETL/ELT pipelines, warehouse, semantic layer, dashboards |
| Common tools | Snowflake, BigQuery, Redshift, Databricks, dbt, Airflow, Fivetran |
| Main risk | Poor data quality and unclear metric definitions |
Introduction
There is a moment in a growing company when reporting starts to feel strangely personal. Finance has one revenue number. Sales has another. Product has a dashboard that looks convincing until someone asks why last week changed overnight. Then a founder opens an old spreadsheet called something like `final_report_v8_real_final.xlsx`, and, well, everyone gets quiet for a second.
That is usually not a dashboard problem. It is a data foundation problem.
In the early days, scattered data is normal. A product database here, Stripe or Adyen there, HubSpot, Salesforce, Jira, Zendesk, Google Analytics, maybe a few CSV exports living in somebody’s Downloads folder. People make it work because they have to. But at some point the company needs numbers that are consistent, fast to access, and trusted enough for real decisions.
That is where data warehouse development comes in. Not as a magic box for every data issue, because no such box exists, but as a practical way to gather business data, clean it up, model it, and make it useful for analytics, BI, reporting, forecasting, and AI work.
This guide walks through the architecture, process, tools, costs, and problems that usually show up along the way. I will keep it practical. Data warehousing can get abstract very quickly, and honestly, that is where many projects start to lose people.
What a Data Warehouse Actually Means
At its simplest, a warehouse project means building a central analytical system. It takes information from multiple sources, checks and transforms it, stores it in a structure made for analysis, and gives people a safer way to use that data in dashboards, reports, internal tools, and product analytics.
The key word is analytical. A warehouse is not the same as the database that runs your product. Your product database needs to be quick at transactions: creating users, saving orders, updating subscriptions, logging events, changing permissions. Heavy reporting on top of that same database can slow things down or create messy one-off queries nobody wants to maintain.
A data warehouse gives analytics its own home. It also sits somewhere between a few related things:
- Operational databases are made for day-to-day transactions.
- Data lakes are good for storing raw files and events, though they can become a swamp if nobody models the data properly.
- Data marts are smaller, team-specific slices of analytical data, often for finance, product, marketing, sales, or operations.
- BI tools show charts and dashboards, but they still need clean models underneath. A dashboard cannot make bad data good. Annoying, but true.
Different companies need different warehouse shapes.
Enterprise Warehouse
Enterprise data warehouse development is focused for company-wide reporting. It brings data from many teams into one governed environment and gives everyone shared definitions for things like revenue, churn, active users, margins, inventory, and customer segments.
This matters when a business has several departments or regions and people keep arguing about which number is the “real” one. In my experience, these arguments are rarely about the chart itself. They are about hidden assumptions inside the data.
Cloud Warehouse
A cloud data warehouse usually runs on Snowflake, BigQuery, Amazon Redshift, Azure Synapse, ClickHouse, or a similar platform. These tools can scale storage and compute in a way that is much more flexible than older on-premise setups.
Cloud is not automatically cheaper, by the way. It is easier to start and easier to scale, yes. But it also makes it very easy to run expensive queries all day without noticing until the invoice arrives.
Real-Time or Near-Real-Time Warehouse
Some teams can live with nightly data refreshes. Others cannot. A real-time data warehouse uses streaming ingestion, change data capture, event pipelines, or faster sync jobs so people can see business activity closer to when it happens.
Fraud monitoring, logistics, marketplaces, risk systems, customer support, and operational analytics often need this. A weekly report is not much help when the issue happened three hours ago.
Data Mart-Based Setup
Data marts are focused analytical stores for specific teams. Finance may need invoices, refunds, revenue recognition, and payment failures. Product may care about activation, retention, feature use, and cohorts. Marketing wants attribution and campaign performance.
Trying to force all of that into one giant all-purpose table is tempting. It usually turns into pain later.
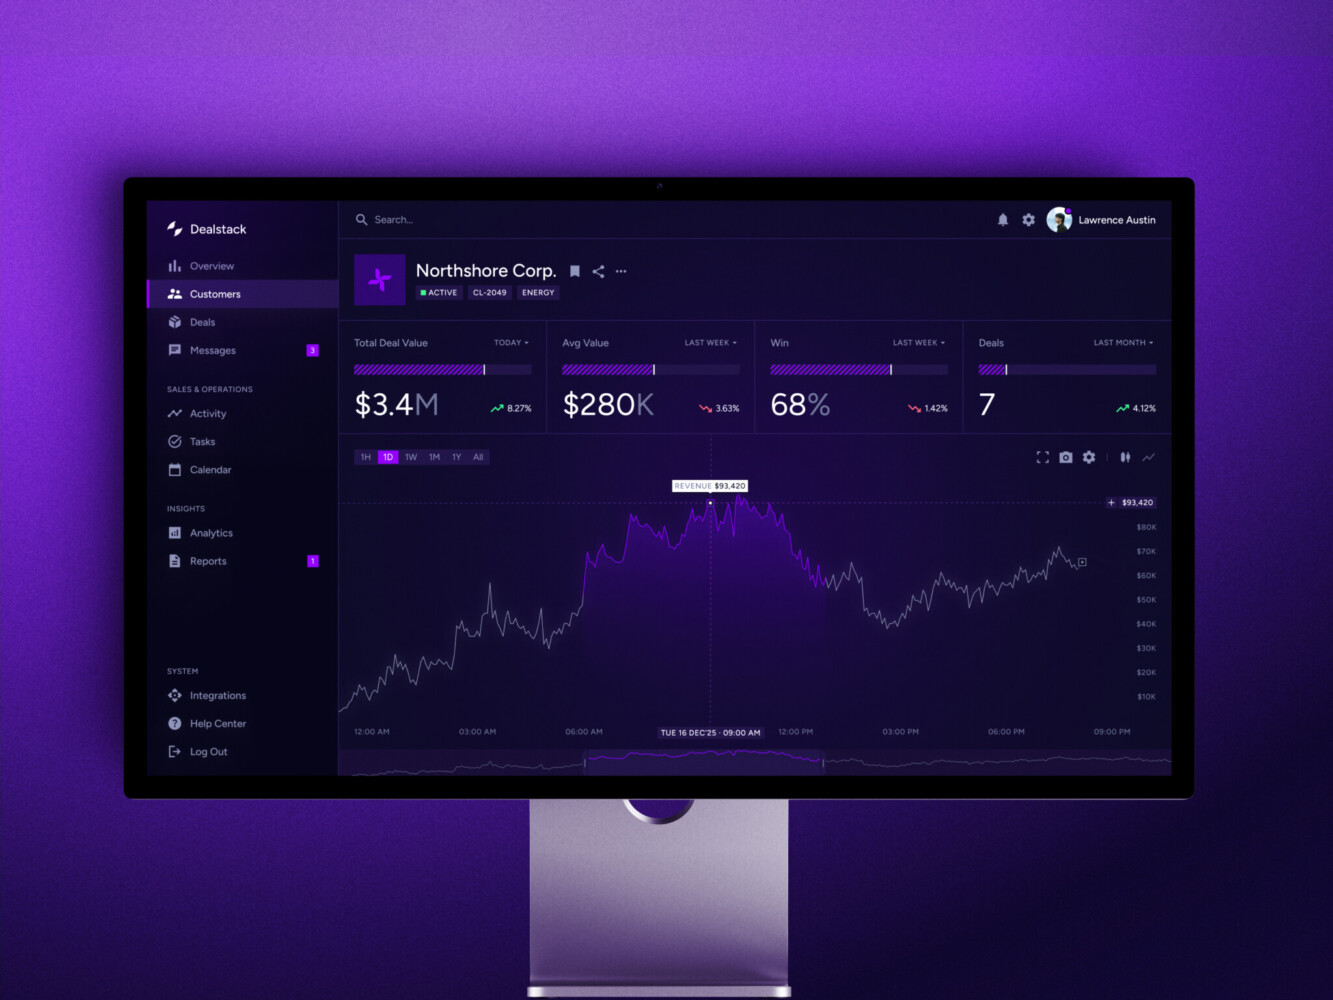
Sales Analytics Dashboard by Shakuro
Core Architecture
The architecture of a data warehouse solution is the plan for how data travels from source systems into a trusted analytical environment. The details differ from company to company, but the pattern is usually familiar: sources, ingestion, staging, transformation, storage, metrics, dashboards, governance, and monitoring.
That sounds neat on paper. In real life, the work is a little messier.
Data Sources
Sources may include CRMs, ERPs, payment systems, product databases, marketing platforms, support tools, IoT devices, APIs, logs, third-party datasets, and old spreadsheets that nobody wants to admit are still important.
The problem is that these systems speak different languages. A customer ID may be an email in one tool, a UUID in another, and a billing account in a third. Time zones drift. Event names change. Product teams rename things. Finance closes a month, and then someone asks why the number in the dashboard is still moving.
Good data warehouse design starts with these boring details. Boring is often where the truth lives.
Ingestion Layer
The ingestion layer moves data into the analytical environment. It can use batch imports, APIs, webhooks, change data capture, streaming pipelines, or connectors like Airbyte and Fivetran.
There is no single best option. A daily finance report may be fine with scheduled loads. A marketplace pricing system might need updates every few minutes. A fraud system may need events almost immediately.
The mistake is choosing a tool before deciding how fresh the data really needs to be.
Staging Area
The staging area is a controlled place for raw or partly processed data. Teams use it to preserve source records, compare changes, validate fields, and prepare transformations.
Business users usually should not report from staging. It is more like the kitchen counter before dinner is plated. Useful, necessary, but not where you invite guests to eat.
ETL and ELT Pipelines
ETL means extract, transform, load. ELT means extract, load, transform. In both cases, data moves from source systems into clean analytical models. The difference is where most transformation happens.
Modern cloud warehouses often favor ELT because the warehouse itself can process transformations efficiently. Still, ETL data warehouse development makes sense when sensitive data must be cleaned, masked, filtered, or reshaped before it lands in storage.
Pipeline work includes schema mapping, deduplication, validation, enrichment, orchestration, retry logic, incremental loads, backfills, and alerts. The alerting part deserves more attention than it usually gets. A silent pipeline failure can ruin a board deck faster than anyone expects.
Storage Layer
The storage layer is where clean, modeled data lives. Depending on the project, teams may use star schemas, snowflake schemas, fact tables, dimension tables, partitions, clustering, columnar storage, and materialized views.
The model should follow business processes, not just mirror source tables. For example, an orders model may need checkout data, payment records, refunds, inventory movement, subscription changes, support tickets, and customer data. The business sees “revenue.” The systems see six different stories.
Semantic and Metrics Layer
The semantic layer defines shared business logic. What is an active user? When does churn count? Which refunds affect revenue? How do we handle currency conversion? Is a trial customer included in pipeline value?
You agree, that sounds like small stuff until two teams present different KPIs in the same meeting. Then it becomes very large stuff.
BI, Reporting, and Analytics Layer
This is where data becomes visible. Teams may use Looker, Power BI, Tableau, Metabase, Superset, custom React dashboards, embedded analytics, scheduled reports, or internal tools.
A business intelligence data warehouse is not valuable just because the data exists. People need fast dashboards, clear filters, export options, permissions, saved views, and sometimes a simple note explaining what a metric actually means. Small UX details can decide whether business users trust the system or go back to spreadsheets.
Governance, Security, and Monitoring
Warehouses often contain customer, financial, healthcare, operational, or commercial data. Governance covers access control, audit logs, lineage, retention, encryption, and compliance rules.
Monitoring covers freshness, failed jobs, data quality checks, query performance, and cloud costs. It is not glamorous work. It is also the thing people miss most when it is absent.
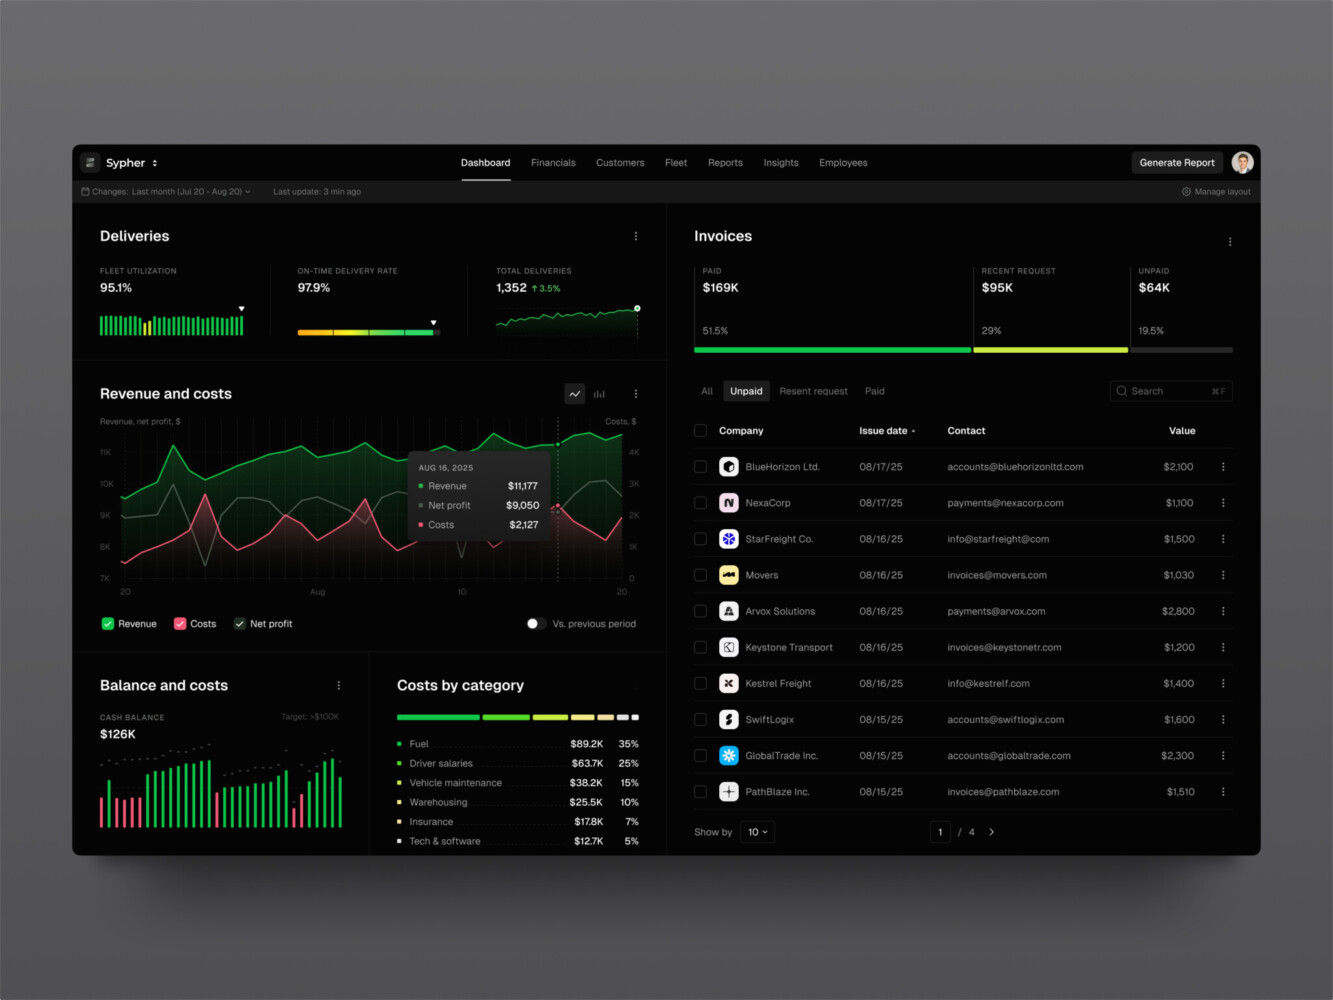
SaaS analytics platform by Shakuro
Key Features of a Modern Data Warehouse
A modern warehouse should not be a dumping ground for tables. It should make data easier to trust and easier to use.
Unified Data Integration
Data from product, sales, finance, marketing, operations, and support should come together in one environment. That data warehouse integration is what lets a SaaS team connect trial behavior, subscription payments, CRM stages, support tickets, and feature usage.
Without that connection, each team sees only a slice. Sometimes the slice is useful. Sometimes it is misleading.
Data Quality Management
Quality checks catch duplicate records, missing fields, invalid values, broken joins, volume drops, and mismatched totals. Reconciliation is especially important when reports must match payment systems, accounting exports, or internal operational tools.
This is the part of the project that can feel slow. I get it. But skipping it usually means paying later, with interest.
Query Performance That Holds Up
As data grows, dashboards slow down. Partitioning, clustering, caching, pre-aggregated tables, and materialized views really help. So does building models around the questions people ask most often.
A dashboard used once a month can be a little slow. A dashboard opened by 40 managers every morning cannot.
Historical Data Storage
Warehouses are useful because they preserve history. They help teams look across months, quarters, years, cohorts, regions, and business cycles.
Operational systems often show the current state. A warehouse can show what changed, when it changed, and how that change affected the business.
Business-Friendly Metrics
In data warehouse development, good metrics should not require detective work. A shared layer for revenue, churn, margin, active users, inventory turnover, customer lifetime value, or claim rates saves teams from rebuilding logic in every report.
It also makes onboarding easier. New analysts should not have to ask, “Which churn number do we use here?” five times in their first week.
Role-Based Access
Not everyone should see everything. Access may depend on team, region, tenant, department, or data sensitivity. This is especially important in fintech, healthcare, enterprise SaaS, and any product that handles customer or financial records.
Permissions are easier to design early than to clean up later in a business intelligence data warehouse development. Nobody enjoys the later version.
Dashboard and Product Integration
Dashboards are often the first thing people notice, even though most of the work sits underneath. Tools like Looker, Power BI, Tableau, Superset, and Metabase can cover many needs. For product-facing analytics, custom interfaces may be better.
That is where frontend development becomes part of the data conversation. Filters, tables, charts, exports, saved views, and embedded reports need to match the way people work.
AI and Predictive Analytics Readiness
Clean historical data is the starting point for forecasting, segmentation, anomaly detection, recommendation systems, and AI-powered analytics systems. If the source data is inconsistent, AI work often turns into cleanup work first.
This is why AI development and warehouse planning often meet in the same room. Not because every warehouse needs AI, but because AI needs reliable data more than it needs a flashy demo.
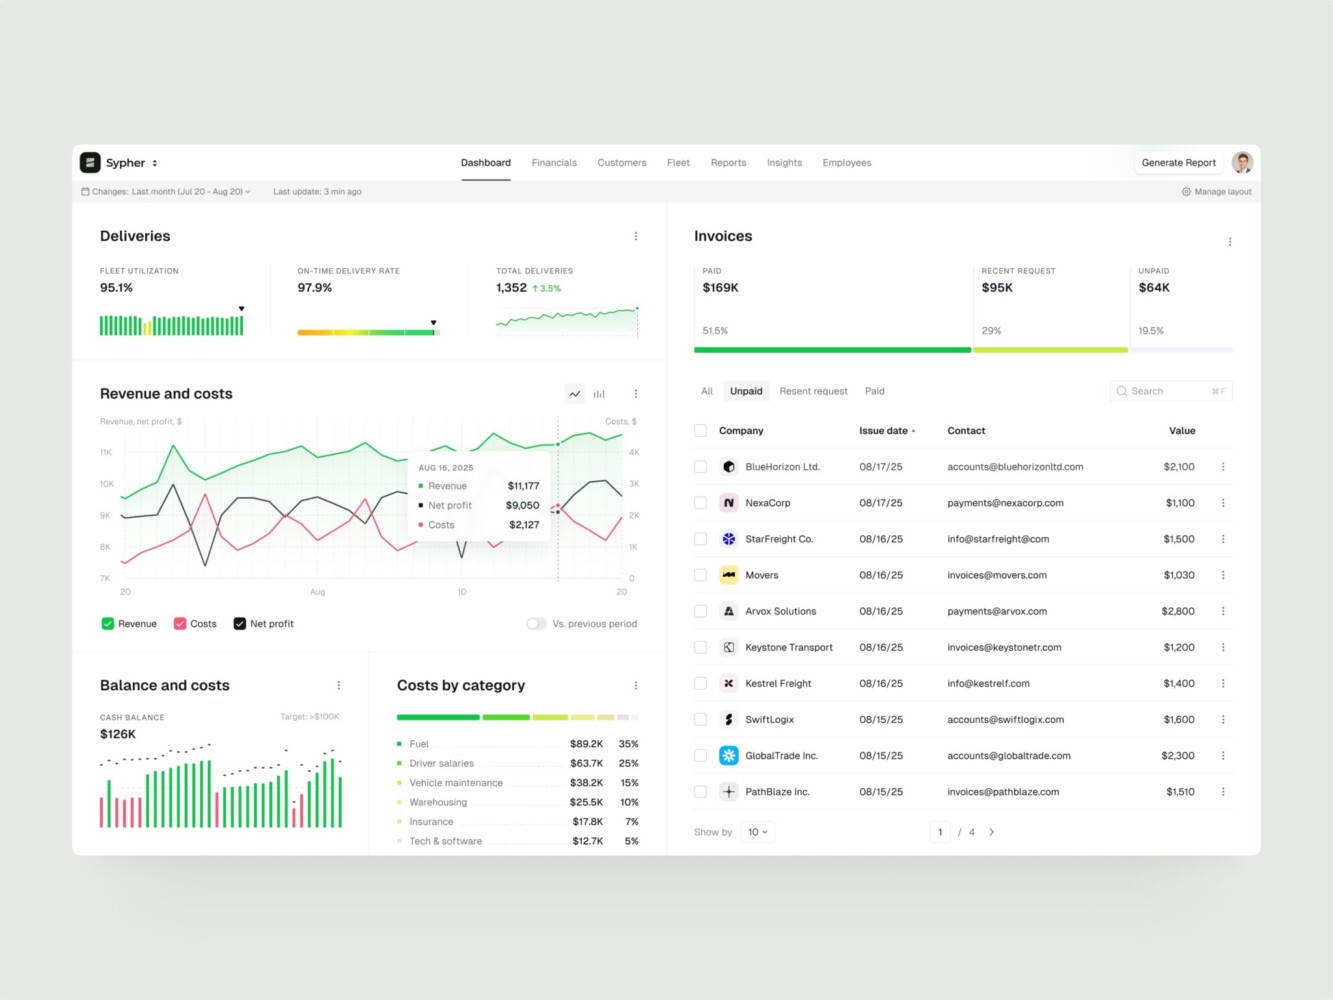
Enterprise Resource Planning B2B SaaS Dashboard by Conceptzilla
How to Build a Data Warehouse
If you are asking how to build a data warehouse, the honest answer is to start with the business questions. Tools come later.
1. Discovery and Data Strategy
First, define what the data warehouse solution should improve. Faster reporting? Better investor updates? Customer analytics? Financial visibility? Operational control? AI readiness?
Then look at the current data setup. Which systems matter? Who owns them? Where do people already distrust the numbers? Which reports are built manually every week? This discovery stage can feel like opening a messy closet. Still, you need to know what is inside.
2. Requirements and KPI Mapping
List the questions the system must answer. For example:
- Which product behaviors predict retention?
- What is net revenue by plan, segment, and region?
- Which campaigns bring customers who stay?
- Where do support issues cluster?
- Which accounts are showing early churn signals?
Then define entities, metrics, dimensions, reporting frequency, access roles, and compliance constraints. This is not paperwork for the sake of paperwork. It prevents expensive confusion later.
3. Architecture Decisions
Choose the modeling approach and deployment pattern. Kimball-style dimensional modeling works well for many BI systems. Inmon-style enterprise models can fit centralized environments. Data Vault helps with complex historical tracking. Lakehouse patterns can make sense when teams need raw storage and curated analytics together.
You also decide between batch, near-real-time, and streaming ingestion. Cloud, on-premise, or hybrid. Simple at first glance, but these choices shape cost and maintenance for years.
4. Stack Selection
A common stack for building a data warehouse architecture may include:
- Cloud platforms such as Snowflake, BigQuery, Amazon Redshift, Azure Synapse, or ClickHouse
- Storage in S3, Google Cloud Storage, Azure Blob, or PostgreSQL for operational metadata
- Pipelines with Airbyte, Fivetran, Kafka, AWS Kinesis, dbt, Apache Spark, or Apache Airflow
- Backend and API work with Python, FastAPI, Node.js, or .NET
- BI and interface tools such as Looker, Power BI, Tableau, Superset, Metabase, and React dashboards
- Infrastructure with Docker, Kubernetes, Terraform, Grafana, Prometheus, and OpenTelemetry
The best stack is the one your team can actually run. A fancy stack nobody understands is just future stress with a logo.
5. Data Modeling
Modeling defines facts, dimensions, slowly changing dimensions, data marts, naming conventions, and metric logic.
Good models follow the business. If the question is about customer lifecycle, the model for a cloud data warehouse may need acquisition source, account creation, activation events, subscription changes, support history, invoices, and churn reasons. Source systems do not care about that full story. The business does.
6. Pipeline Development
Pipeline development covers connectors, ingestion jobs, transformations, validation rules, retry handling, orchestration, incremental loads, CDC, schema changes, and backfills.
This is where small details matter. A renamed event, late-arriving record, duplicate ID, or failed job should not quietly break the executive dashboard.
7. BI, API, and Interface Work
Once curated models are ready, teams connect dashboards, internal tools, embedded analytics, and APIs.
Sometimes a standard BI tool is enough. Sometimes the analytics layer needs custom web development, especially when users need complex tables, account-level reporting, saved filters, exports, or product-native dashboards.
8. Testing and Reconciliation
Testing checks whether reports match source systems and business rules. It should cover missing data, duplicates, late events, failed jobs, timezone logic, currency conversion, permissions, and odd edge cases.
QA in data work is not just clicking around dashboards. It is checking whether the numbers are believable.
9. Deployment and Ongoing Care
After launch, the data warehouse needs CI/CD for data models, monitoring, freshness alerts, quality checks, query tuning, access audits, and cost controls.
Data systems are never truly finished because the business is never truly still. New products, new markets, new fields, new questions. Long-term support and maintenance keeps the system from slowly turning into a mystery.

Telematics Company SaaS Dashboard by Shakuro
How Much Does Data Warehouse Development Cost?
It depends on the number of sources, data volume, refresh frequency, cloud pricing, pipeline complexity, modeling depth, dashboard work, security, compliance, and support needs.
Roughly speaking, there are three common levels.
MVP Warehouse
An MVP may include 3-5 data sources, batch ingestion, basic transformations, one core model, several dashboards, and cloud setup.
- Team: 2-4 engineers plus an analyst or designer.
- Timeline: 2-4 months.
- Cost: $50,000-$150,000.
This is a good starting point when the company needs reliable reporting but can keep the first version focused.
Mid-Level Cloud Setup
A mid-level project may include 8-15 integrations, dbt models, Airflow orchestration, finance, product, and customer marts, role-based access, BI dashboards, and quality checks.
- Team: 5-8 people across data engineering, backend, QA, analytics, and design.
- Timeline: 4-8 months.
- Cost: $150,000-$450,000.
This range is common for SaaS, fintech, marketplace, e-commerce, and healthcare teams where analytics already affects several departments.
Enterprise Warehouse or Lakehouse
Enterprise data warehouse development may include multi-region data, near-real-time pipelines, governance, lineage, advanced access control, multiple domains, AI-ready datasets, custom analytics APIs, and serious performance requirements.
- Team: 10-20+ specialists.
- Timeline: 9-18+ months.
- Cost: $500,000-$2,000,000+.
At this level, data warehouse consulting before implementation is usually worth it. It is much cheaper to argue about architecture on a whiteboard than to rebuild six months of pipelines.
| Feature | MVP Warehouse | Mid-Level Cloud Setup | Enterprise Warehouse or Lakehouse |
| Scope & Components | • 3-5 data sources
• Batch ingestion • Basic transformations • One core model • Several dashboards • Cloud setup |
• 8-15 integrations
• dbt models • Airflow orchestration • Finance, product, and customer marts • Role-based access • BI dashboards • Quality checks |
• Multi-region data
• Near-real-time pipelines • Governance & lineage • Advanced access control • Multiple domains • AI-ready datasets • Custom analytics APIs • High performance requirements |
| Team Composition | 2-4 engineers plus an analyst or designer | 5-8 people (Data Engineering, Backend, QA, Analytics, Design) | 10-20+ specialists |
| Timeline | 2-4 months | 4-8 months | 9-18+ months |
| Estimated Cost | $50,000 – $150,000 | $150,000 – $450,000 | $500,000 – $2,000,000+ |
| Best For | Companies needing reliable reporting who can keep the first version focused. | SaaS, fintech, marketplace, e-commerce, and healthcare teams where analytics affects several departments. | Large-scale operations requiring robust architecture. Consulting before implementation is recommended to avoid costly rebuilds. |
Common Challenges
Even good teams run into trouble. Data work has a way of revealing all the little compromises a company made over time.
Poor Data Quality
Missing fields, duplicate records, inconsistent IDs, timezone problems, and conflicting metric definitions can make reports unreliable. The warehouse may expose the mess, but it will not clean it by itself.
Source System Complexity
CRMs, ERPs, payment tools, product databases, legacy systems, and third-party APIs rarely fit together neatly. Source APIs change. Exports behave strangely. A field that looked stable on Monday gets renamed on Friday.
Schema Changes
Product teams ship changes. Events get renamed. New pricing appears. Old fields disappear. Without versioning, contracts, and monitoring, these changes break pipelines.
Query Performance
Reports slow down when data grows and models are not designed around real usage. Partitioning, clustering, pre-aggregation, caching, and better semantic logic can help, but they need planning.
Cloud Cost Spikes
Cloud tools are convenient, which is exactly why costs can drift. Heavy queries, repeated refreshes, large scans, and no workload controls can turn into a painful bill.
Security and Access
Sensitive data needs strict permissions, encryption, audit logs, and governance. This is not optional in regulated industries, and it is still smart in less regulated ones.
Low Adoption
This one hurts because it can happen after the engineering work is technically solid. If dashboards do not answer real questions, people will ignore them. If users do not trust the metrics, they will rebuild the numbers somewhere else.
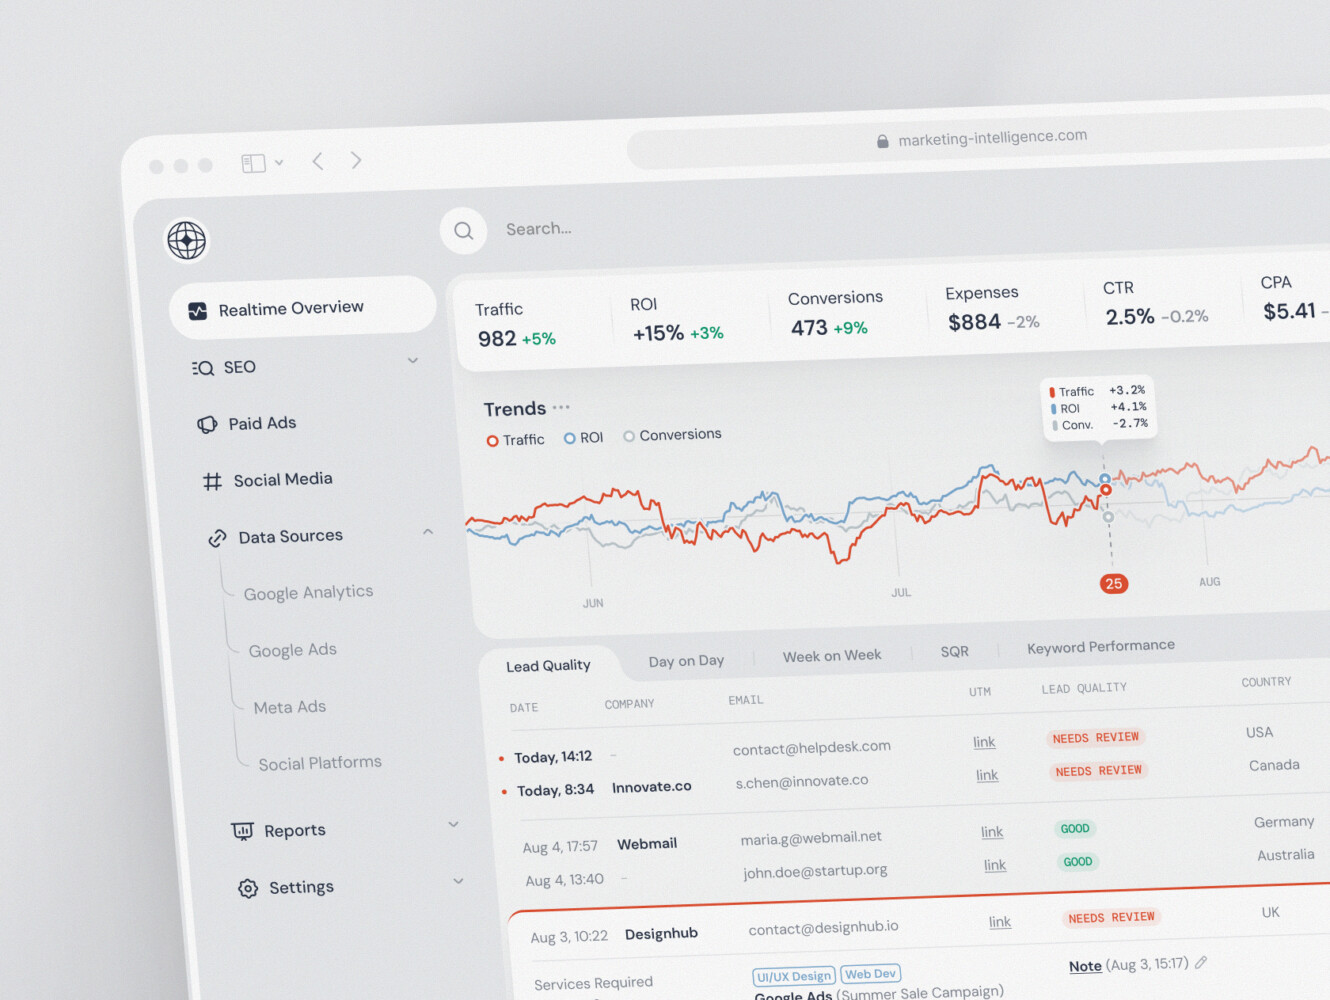
SaaS marketing dashboard by Conceptzilla
Our Experience in Data-Heavy Platform Development
Shakuro works with SaaS, fintech, analytics, and operational platforms where complicated data has to become something people can actually use. That user-facing layer is easy to underestimate when it comes to data warehouse development services.
Owari: SaaS Platform for West African Oil and Gas Markets
Owari is a SaaS product for traders, brokers, and analysts in the West African oil and gas market. It helps users find opportunities and manage risk through dense commodity-market data.
Shakuro built dashboards, data-heavy tables, stock-level views, country data, vessel tracking, energy maps, visualization APIs, algorithms, and a scalable design system. We created a custom backend and frontend in a close collaboration with the design team.
Owari is not a warehouse case in the narrow storage-layer sense. It shows what happens after data has been collected and validated: people need maps, tables, filters, and decision-support views that make sense under pressure.
Symbolik Social: Financial Analytics and Social Platform
Symbolik Social is an institutional-grade financial analytics and knowledge platform for traders, investors, and money managers.
The product combines professional analytics with collaboration, dense market-analysis workflows, profiles, discussions, and interface patterns for sharing insight around data.
Symbolik is a good reminder that analytical systems are not only storage and models. They also need permissions, context, and interfaces that people trust enough to use every day.
You can also look at Shakuro’s work across SaaS and fintech, where analytics often touches product, operations, compliance, and growth at the same time.
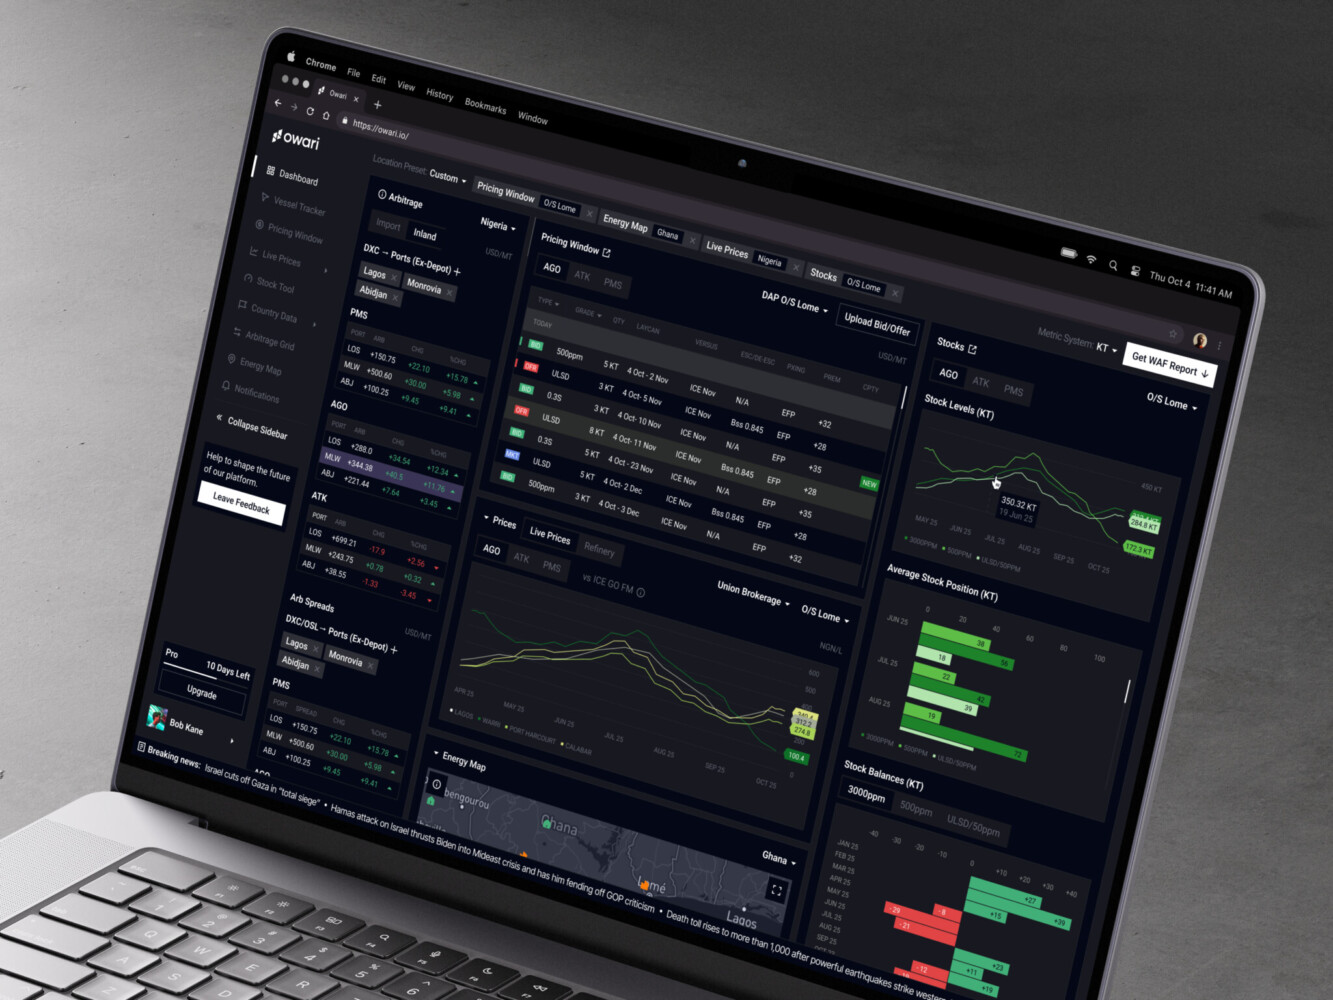
Owari dashboard by Shakuro

Why Opt For a Data Warehouse Consulting
A specialist data partner can help when a project crosses architecture, backend, analytics UX, QA, security, and long-term operations.
The useful part is not just “more engineers.” It is having people who have seen where these systems usually crack: unclear metrics, fragile connectors, dashboards nobody uses, missing monitoring, permissions added too late, or cloud costs nobody owns.
Experienced data warehouse developers should help with:
- Architecture for ingestion, modeling, storage, performance, and governance
- Backend and data engineering for pipelines, APIs, integrations, and monitoring
- Analytics UX so dashboards and reports fit real workflows
- Security and compliance around access control, audit logs, encryption, GDPR, and SOC 2 readiness
- Delivery across strategy, UX/UI, backend, frontend, QA, deployment, and support
For SaaS teams, this can be especially useful because analytics touches product strategy, customer success, revenue operations, investor reporting, and sometimes AI planning all at once.
Final Thoughts
A warehouse is not valuable because it sounds sophisticated. It is valuable when it helps people stop guessing.
Data warehouse development is usually simple to describe and hard to do well: collect data from many sources, bring it into a controlled environment, clean it, model it, define metrics, connect dashboards, monitor the system, and keep improving it as the business changes.
Three things matter most.
Accuracy, because nobody uses reports they do not trust.
Architecture, because the system has to handle new sources and more data later.
Usability, because a warehouse that nobody can understand is just another expensive backend project.
Ready to build a data warehouse that turns scattered business data into reliable analytics? Let’s talk. Shakuro can help with architecture, development, data-heavy interfaces, and long-term support.
FAQ
What Does Data Warehouse Development Include?
It includes strategy, architecture, source integration, pipeline development, data modeling, validation, dashboard or API integration, monitoring, and maintenance. The point is to turn scattered business data into trusted analytical models.
How Long Does Implementation Take?
A focused MVP can take 2-4 months. A mid-level project often takes 4-8 months. Enterprise work with governance, real-time pipelines, lineage, and multiple domains may take 9-18+ months.
What is the Difference Between a Warehouse and a Data Lake?
A data lake stores raw or semi-structured data in a flexible way. A warehouse stores cleaned and modeled data for reporting and analysis. Many companies use both.
Which Tools are Commonly Used?
Common tools include Snowflake, BigQuery, Redshift, Azure Synapse, ClickHouse, dbt, Airflow, Kafka, Spark, Airbyte, Fivetran, Python, FastAPI, Looker, Tableau, Power BI, Metabase, and custom React dashboards.
When Should I Consider Custom Data Warehouse Development?
It is worth considering when reports do not match, dashboards are slow, teams rely on manual spreadsheet work, data comes from many systems, or leadership needs reliable analytics for growth, operations, fundraising, compliance, or AI planning.