
Slow web apps have a way of making people quietly angry.
Contents:
That small sigh when a dashboard takes five seconds to load, or when a checkout button looks clickable but nothing happens. Teams spend months polishing a product flow, then lose users because one heavy script, one slow API, or one awkward loading state made the whole thing feel clumsy. It is a little painful, because the product may actually be good.
That is why web app performance optimization is not just a technical housekeeping task. It is part user experience, part engineering discipline, part business protection. If a web app feels fast and steady, people trust it more. If it feels slow, they start looking for workarounds, or worse, alternatives.
This guide walks through the practical side of speed and stability: which metrics matter, how testing should work, what to monitor after launch, and where teams usually find the biggest wins.
Key takeaways
- Web app performance optimization is ongoing work, not a one-time fix.
- Track both technical metrics, like Core Web Vitals and API latency, and business metrics, like conversion or retention.
- Test real user flows, not only the homepage.
- Monitoring after launch is just as important as pre-launch testing.
What is Web App Performance Optimization?
This kind of optimization is the ongoing work of making a web application load faster, respond faster, stay stable, and use resources wisely.
That sounds simple. In practice, it covers a lot: frontend code, server response time, database queries, caching, images, fonts, third-party scripts, hosting, mobile behavior, and even design decisions. A beautiful interface with a giant uncompressed image can still feel bad. A clean backend with a bloated JavaScript bundle can still frustrate users.
The important word here is ongoing. Performance is not something you fix once, celebrate, and forget. New features add weight. Traffic changes. Browsers update. A marketing pixel gets added before a campaign, and suddenly your page feels like it is dragging a suitcase through mud. Well, you know how it goes.
Good optimization work is about finding the places where speed, stability, and usability affect real people using the product.
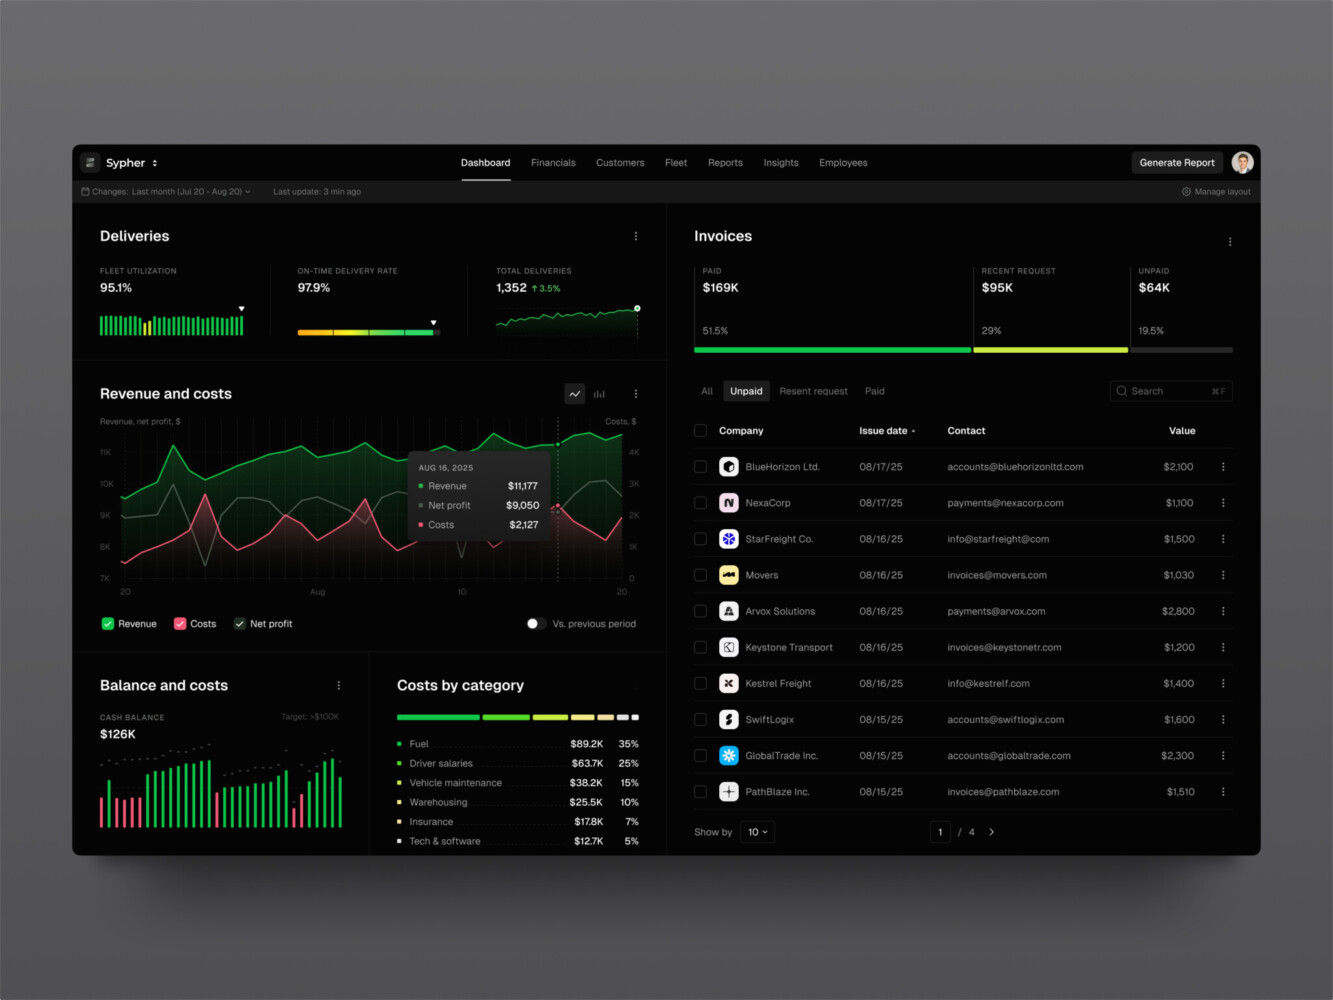
SaaS analytics platform by Shakuro
Key Web App Performance Metrics to Track
Before fixing anything, you need numbers. Otherwise, everyone in the room has a different version of “slow.”
The right metrics help turn vague complaints into something you can discuss, prioritize, and improve. Some are technical. Some are closer to product analytics. Both matter.
Core Web Vitals
Core Web Vitals are a good starting point because they connect technical behavior with user experience.
Largest Contentful Paint, or LCP, shows how long it takes for the main content to become visible. If your hero area, dashboard panel, or main product list takes forever to appear, LCP will usually tell on you.
Interaction to Next Paint, or INP, measures responsiveness. This one often feels very human. You click a button, then wait. Nothing. Then suddenly something happens. Not great.
Cumulative Layout Shift, or CLS, tracks visual stability. If a user is about to click “Buy” and an ad or image pushes the button down, that is not just annoying. It can break trust.
Frontend Metrics
Frontend metrics show what is happening in the browser. Watch Time to First Byte, First Contentful Paint, JavaScript execution time, bundle size, hydration time, image weight, and font loading behavior.
In my experience, JavaScript weight is one of those things teams underestimate. One dependency becomes three. Three become ten. Then the app ships a large bundle to every user, including someone on a tired mobile connection in a cafe with bad Wi-Fi. It happens more often than people admit.
Backend and Infrastructure Metrics
The backend has its own story to tell: API latency, throughput, error rate, database query time, cache hit ratio, queue processing time, CPU usage, memory pressure, and server saturation.
A frontend can be beautifully tuned and still feel slow if the API needs two seconds to answer. And one more point: average response time is not enough. Apart from web app performance metrics, look at percentiles, especially p95 and p99. Users do not care that the average request is fine if their request is the slow one.
Product and Business Metrics
Performance should also be tied to outcomes. Track conversion rate, bounce rate, task completion, retention, trial activation, cart abandonment, or whatever matters for your product.
This is where speed stops being a developer-only conversation. If a faster onboarding flow helps more people reach the “aha” moment, that is not just a technical improvement. That is product work.
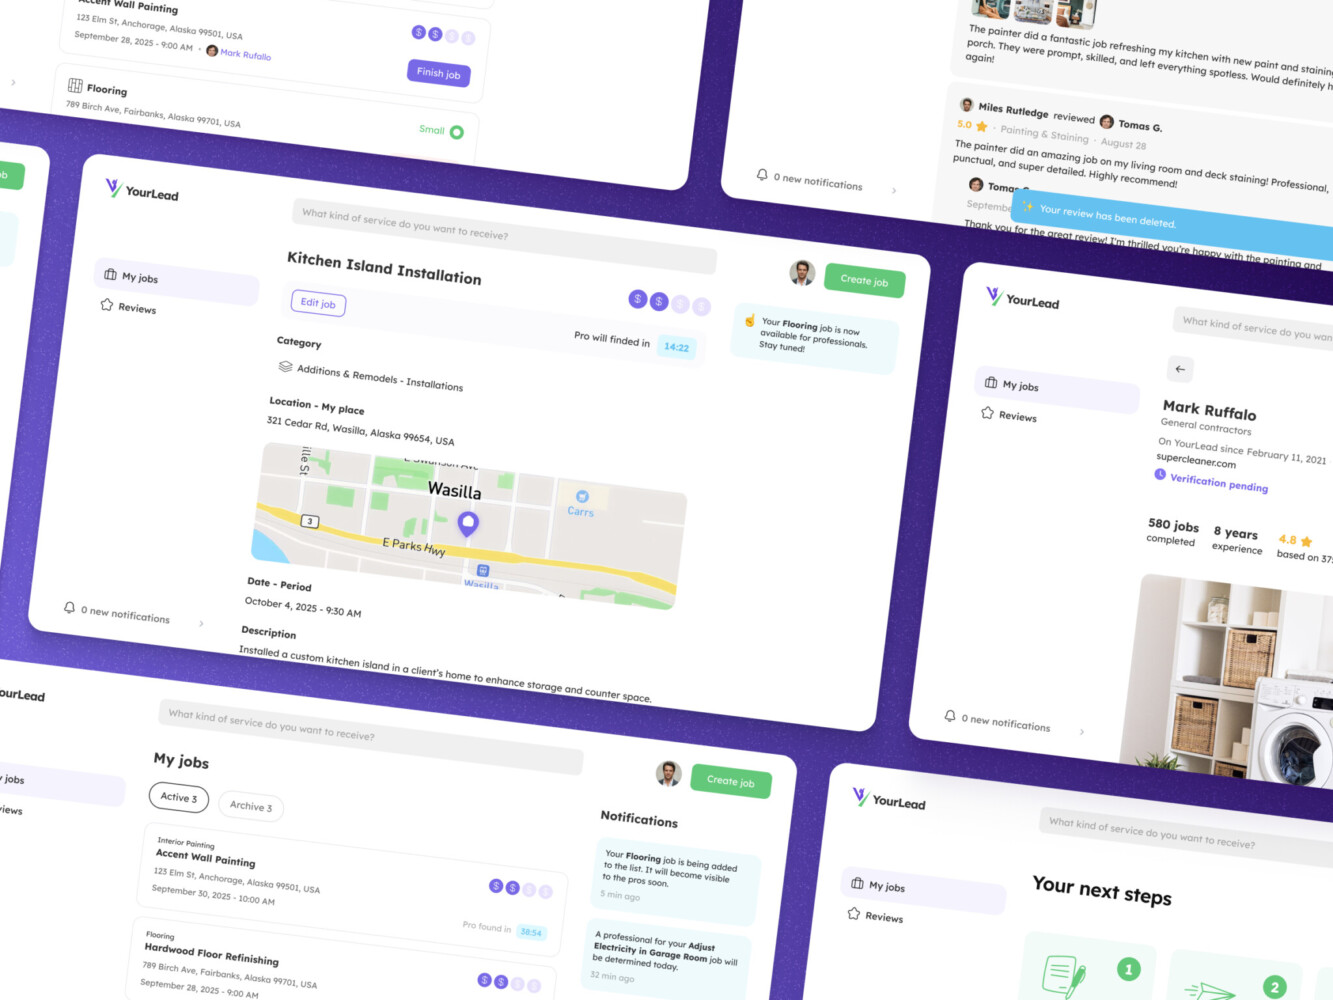
Design for Construction Lead Generation Platform by Shakuro
How to Run Web App Performance Testing
Testing is the controlled process of measuring how your application behaves under realistic conditions. It answers a basic question: what is slow, when does it get slow, and for whom?
Start with a baseline audit. Lighthouse, Chrome DevTools, WebPageTest, and browser performance profiles are useful here. They are not magic, but they give you a clear first look at load time, render-blocking resources, unused code, image issues, and layout shifts.
Then test real flows. Not just the homepage. During web app performance optimization, test login, search, checkout, account creation, dashboard loading, report generation, settings updates, media upload, and any flow that users repeat often. A landing page score can look fine while the actual product experience feels heavy.
It is also worth testing on real devices, especially if your audience uses mobile a lot. A powerful laptop on office internet can hide problems. A mid-range phone will be more honest with you. Sometimes brutally honest.
For APIs and infrastructure, add load testing and stress testing. You want to know how the app behaves when traffic grows, when many users hit the same endpoint, or when a background job starts competing for resources. The goal is not to break the system for fun. The goal is to find the weak spots before users do.
By the way, testing should happen before and after changes. If you optimize images, split code, or add caching, measure again. I have seen “performance fixes” that made one metric better and another one worse. That is a little annoying, but you get used to checking.
Web App Performance Monitoring After Launch
Testing gives you snapshots. Monitoring tells you what happens in the real world.
This distinction matters. Lab tests happen in a controlled setup. Production users bring all the chaos: old browsers, spotty networks, unusual device sizes, long sessions, weird user flows, and traffic spikes at exactly the wrong time. You agree, that sounds good to catch early, doesn’t it?
A strong monitoring setup usually includes real user monitoring, synthetic monitoring, server logs, distributed traces, error tracking, uptime checks, and alerting. Real user monitoring shows how actual visitors experience your app. Synthetic monitoring runs scheduled checks against key flows. Traces help you see where time is being spent across services.
For infrastructure, tools like Prometheus and Grafana are common because they help teams watch server health, latency, error rates, and resource usage. Shakuro also references these tools in its custom web development stack, along with CI/CD practices and cloud-native infrastructure. That kind of setup is useful because performance work becomes visible, not hidden in scattered logs.
Web app performance monitoring should also watch releases. A new feature can quietly increase bundle size or slow down an endpoint. If nobody is watching, the team may discover it weeks later through support tickets. Not ideal.
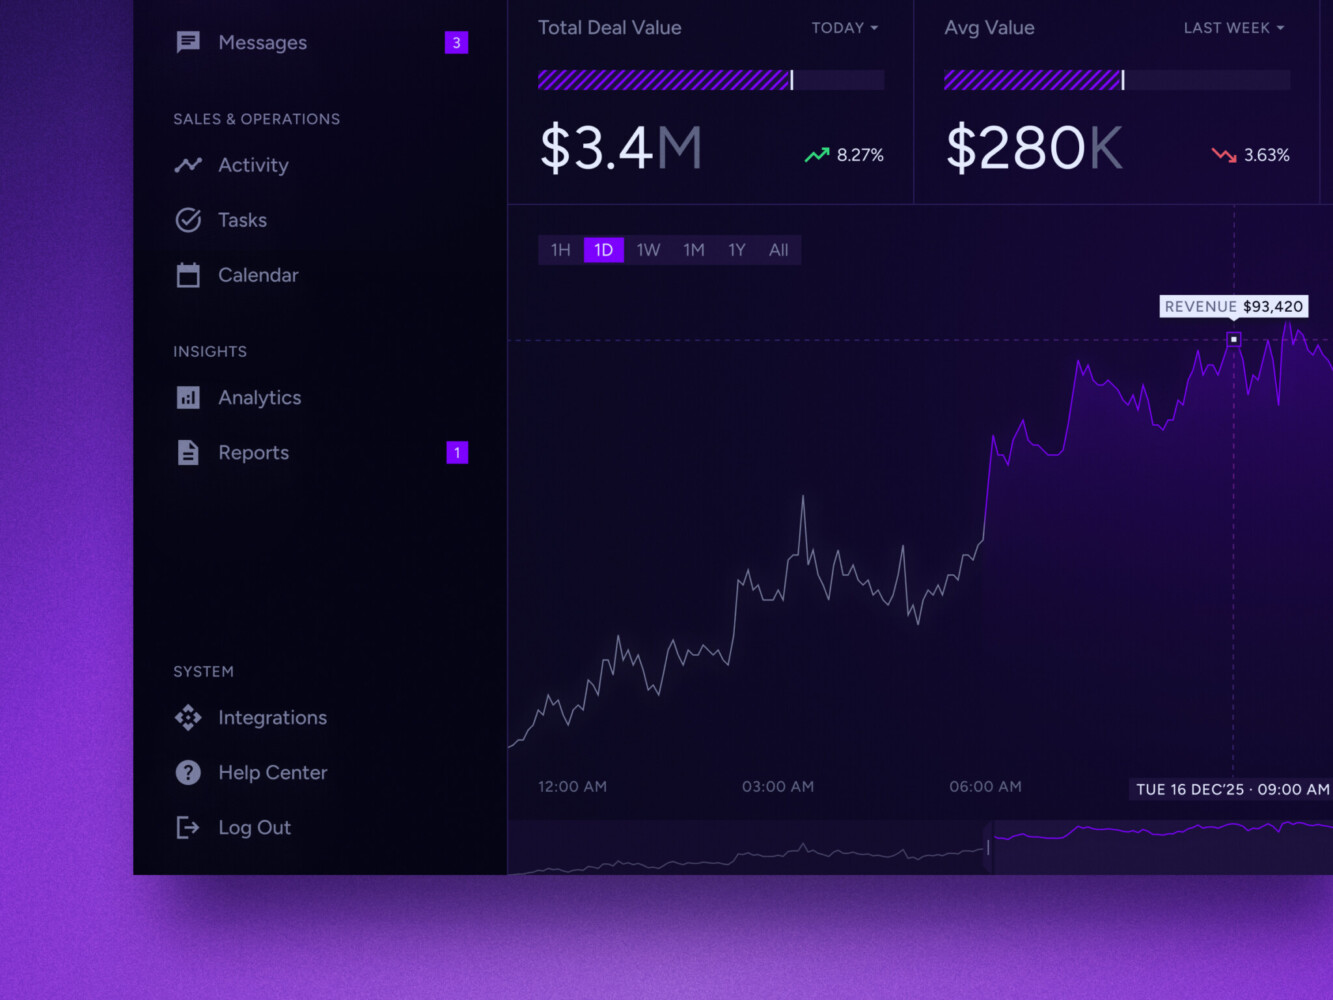
Real-time data dashboard by Shakuro
Frontend Optimization Techniques
Frontend optimization is often where users feel improvements first.
Start with the bundle. Code splitting helps avoid sending the entire application to every user at once. Lazy loading delays non-critical code, images, or components until they are needed. This really helps when a product has dashboards, modals, charts, admin tools, and settings screens that do not all need to load immediately.
Images deserve special attention. Compress them, serve modern formats when possible, use responsive sizes, and avoid loading huge desktop images on mobile. It sounds basic, yes. Still, oversized images are everywhere.
Fonts can also slow things down. Use fewer font weights, preload carefully, and make sure text remains visible during loading. Nobody opens a web app hoping to stare at invisible text.
If the app uses React, rendering behavior matters. Avoid unnecessary re-renders, memoize expensive components when it makes sense, and keep state scoped in a sane way. Do not memoize everything just because it sounds responsible. That can become its own mess.
Framework choices can help too. Next.js, for example, can support server-side rendering, static generation, routing, and performance-minded delivery patterns.
The bigger lesson is simple: frontend performance works best when it is part of the architecture, not a cleanup task at the end.
Also, when doing web app performance optimization, be careful with third-party scripts. Analytics, chat widgets, heatmaps, ads, A/B testing tools, social embeds. Each one seems small in a meeting. Together, they can make the browser work too hard. I once watched a page feel slower after removing only two marketing scripts. The design did not change, the backend did not change, but the page suddenly felt lighter. Small things pile up.
Backend and Infrastructure Optimization
The backend is where many performance problems hide behind a decent-looking interface.
API response time is the obvious place to start. Look for slow endpoints, repeated calls, oversized payloads, and unnecessary round trips. Sometimes the frontend asks for data in a way that forces the backend to do too much work. Sometimes the backend sends far more data than the screen needs. Both are fixable.
Database performance is another common pain. Missing indexes, inefficient joins, N+1 queries, poorly shaped search, and heavy reports can make an app crawl. A query that works nicely with 5,000 records may become painful with 500,000.
Caching can be a big win, but it needs care. Cache static assets, repeated API responses, expensive computations, and predictable content. But do not cache blindly. Stale data can create confusing product behavior, especially in finance, healthcare, marketplaces, or admin dashboards where users expect fresh information.
Infrastructure also matters: CDN usage, autoscaling, queues, rate limiting, background jobs, and deployment pipelines. That mix is important because web app performance depends on the whole system. Not one heroic fix.

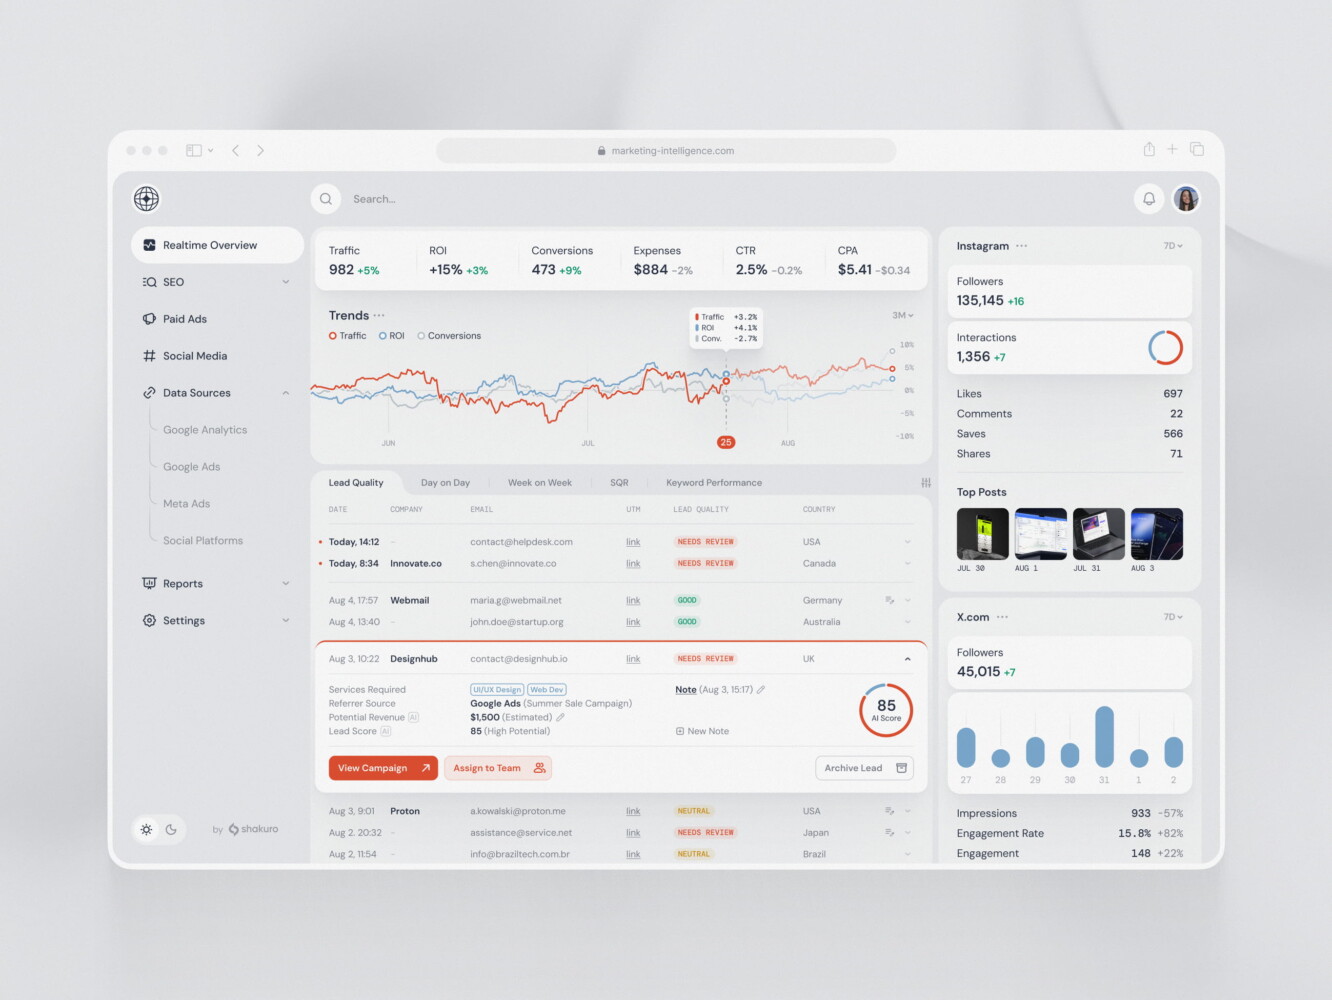
Marketing analytics dashboard by Shakuro
Common Performance Bottlenecks in Modern Web Apps
Some bottlenecks show up again and again.
Heavy JavaScript is one. Large bundles, unused dependencies, duplicated packages, too much client-side rendering, and expensive components can make the app slow even before the backend gets involved.
Unoptimized media is another. Images, videos, icons, animations, and custom fonts can quietly become the heaviest part of a page.
Slow APIs are common too. Maybe the endpoint does too much. Maybe it waits on several services. Maybe the database query is not indexed. Maybe a third-party API is slow and nobody planned for it.
Chatty frontend-backend communication can also hurt. If one screen needs 12 requests to become useful, users will feel that delay. Batching, better API design, or smarter data loading can help.
Then there are third-party scripts, weak caching, missing monitoring, and background jobs that compete for resources. None of these sound glamorous. But fixing them can make the product feel noticeably better.

A Practical Web App Performance Optimization Process
A sensible process keeps the team from fixing random things just because they are visible.
First, audit current metrics and user flows. Look at lab data, field data, backend metrics, and product analytics. Talk to support if you have it. Support teams often know where users get irritated before dashboards show it.
Second, prioritize by impact. A slow settings page that one admin uses monthly is not the same as a slow checkout or signup flow. Both may matter, but not equally.
Third, optimize the frontend. Reduce bundle weight, lazy load non-critical assets, improve images, clean up rendering, and remove or defer scripts that do not need to block the page.
Fourth, improve APIs, database behavior, and caching. This is where engineering judgment matters. You do not want to add a cache that hides a deeper data-model problem.
Fifth, test again. Run the same flows. Compare before and after. Check that one fix did not move the problem somewhere else.
Sixth, add web app performance monitoring and regression alerts. If performance gets worse after a release, the team should know quickly.
Finally, repeat. Performance work is a habit. A slightly boring habit, maybe, but a very useful one.
SaaS marketing dashboard by Conceptzilla
Cost of Web App Performance Optimization
Costs vary a lot because performance problems come in different sizes.
A small audit and quick fixes might take a few days to a couple of weeks. This can include image compression, basic caching, simple frontend cleanup, Lighthouse fixes, and a short report with priorities.
A mid-sized optimization sprint may take several weeks. That usually means profiling real user flows, reducing JavaScript weight, improving API response times, adding monitoring, tuning database queries, and checking mobile performance.
A complex modernization effort can take months. This happens when performance issues are tied to architecture: old frontend patterns, fragile backend services, poor database design, missing observability, or infrastructure that cannot scale smoothly.
The biggest cost drivers are app size, traffic, tech stack, technical debt, number of critical user flows, monitoring maturity, and how risky the product is. A content site, a SaaS dashboard, and a healthcare platform do not need the same plan.
| Scope | Approximate cost | Typical timeline | What is usually included | Best for |
| Small audit | $2,000-$7,000 | 3-10 business days | Lighthouse and Core Web Vitals review, basic frontend audit, quick backend/API checks, image and asset review, prioritized recommendations | Teams that need a clear first diagnosis before planning deeper work |
| Mid-sized optimization | $10,000-$35,000 | 3-8 weeks | User-flow testing, frontend bundle cleanup, image and font optimization, API profiling, database query tuning, caching improvements, monitoring setup, before/after reporting | Products with visible slowdowns in key flows like signup, checkout, dashboards, or search |
| Complex modernization | $50,000-$150,000+ | 2-6+ months | Architecture review, frontend refactoring, backend and database redesign, infrastructure scaling, CI/CD performance gates, observability, load testing, phased rollout | Larger apps where performance problems come from old architecture, heavy technical debt, or growth pressure |
Our Experience in Web App Performance Optimization
We have been building and optimizing apps for more than 19 years. So there are many cases of web app performance optimization in our portfolio. For example:
Proko, an online drawing and painting education platform with thousands of daily users. It is a content-heavy learning product, which is a good reminder that performance is tied to attention. If lessons, media, navigation, or account flows feel sluggish, users may lose focus. And honestly, learning something difficult is already hard enough. By the way, we optimized the web app for both desktop and mobile. That means different screen sizes, stacks, and even workflows.
Another one is Inspired, a platform built for innovators, experts, and investors. The case includes web and mobile work, responsive UI, product design, frontend and backend development, and launch support. That makes it relevant here because performance is not only about speed tests. It is also about keeping a multi-platform product usable, consistent, and ready for real users.
Mobile App Design for Inspired by Shakuro
Why Work With a Web Development Company on Performance Optimization?
You can fix some web app performance issues in-house, of course. Many teams should. Compress images, remove unused scripts, clean up obvious bottlenecks, and check your database indexes. No mystery there.
But when performance problems touch architecture, UX, backend logic, frontend rendering, infrastructure, testing, and monitoring at the same time, it can help to bring in a team that has seen the pattern before.
A web development company can look at the product as a whole: how the interface loads, how APIs respond, how data moves, how releases are tested, and how monitoring catches regressions. That broader view is useful because slow apps rarely have one single cause.
We offer full-cycle web development from concept and UI/UX through frontend, backend, testing, launch, maintenance, and scaling. That is the kind of coverage performance work often needs. Not because every project requires a huge team, but because the problem can live anywhere in the stack.
Final Thoughts
Good performance is easy to notice and hard to fake.
Users may not know your LCP score. They may never say “your API latency feels high.” But they can feel hesitation, jumping layouts, slow clicks, frozen dashboards, and pages that make their phone heat up. They notice, even if they do not name it.
The best approach to web app performance optimization is steady and practical: measure the right things, test real flows, monitor production, fix the biggest bottlenecks first, and keep performance in the release process. It is not glamorous every day. Still, it pays off.
If your web app feels slower than it should, start with a technical performance audit. Shakuro offers web development, frontend development, React expertise, QA, monitoring, and a free code audit option on its custom web development page. That is a good place to begin if you want outside eyes on the product.
FAQ
What is Web App Performance Optimization?
It’s the process of making a web application feel faster, more responsive, more stable and more efficient to users. It usually involves frontend work, backend tuning, caching, infrastructure changes, testing and monitoring.
Which Performance Metrics Matter Most?
Start with Core Web Vitals: LCP, INP, and CLS. Then add frontend metrics like bundle size and JavaScript execution time, backend metrics like API latency and database query time, and product metrics like conversion rate or task completion.
How Often Should Web App Performance Testing be Done?
At minimum, test before launch, after major releases, and whenever users report slowness. For active products, it is better to include performance checks in the development and QA cycle, because regressions can sneak in quietly.
What is the Difference Between Testing and Monitoring?
Testing checks performance in planned scenarios. Monitoring watches what happens after launch with real users, real traffic, real devices, and real problems. You need both.
How can React or Next.js Improve Web App Performance?
React can be used to achieve fast and interactive interfaces if components , state and rendering are handled correctly . Next.js can help with server-side rendering , static generation , routing and performance-oriented delivery . But tools alone do not save a product. The implementation still matters a lot.