Key Takeaways:
- Start with the backbone. Don’t build fancy seller dashboards until you have a reconciled internal view of orders and payments. Trust your numbers first.
- Pick the right liquidity metric. There’s no one-size-fits-all. Use booking fill rate for services or sell-through for goods. If you pick the wrong one, you’ll measure the wrong things.
- Centralize your definitions. Arguing about what “GMV” means in meetings is a waste of time. Agree on formulas once, code them in a shared layer, and stick to it.
- Protect seller data fiercely. Server-side scoping isn’t optional. If Seller A can see Seller B’s data, you’ve lost trust. Test this relentlessly.
- Keep the MVP boring. Focus on daily freshness, not real-time streaming. You can always upgrade later, but you can’t fix bad data easily.
So, you’ve built a marketplace. Or maybe you’re knee-deep in building one right now.
But you look at your dashboard and see GMV going up, user signups ticking along… and yet, something feels off. You can’t quite put your finger on it. Why did that seller churn last week? Was it price? Service? Or did they just get bored? And why are buyers abandoning carts at step three of checkout? Is the UI broken? Or is trust missing?
You guess. You hold meetings. You argue about gut feelings. Sound familiar?
Building a proper analytics system for a two-sided market isn’t like doing it for a standard ecommerce app. You’ve got buyers, sellers, transactions, disputes, liquidity metrics… it’s a lot.
If you’re tired of guessing and want to start knowing, stick around. We’ll walk through the whole process of creating a marketplace analytics system together.
What Is a Marketplace Analytics System?
It’s not just a fancy dashboard with pretty charts. Think of it more like a central nervous system. It takes in a whole bunch of raw, messy inputs—buyer clicks, seller uploads, order confirmations, payment settlements, refund requests—and churns them into something useful. Outputs. Clear metrics. Reports that make sense.
The magic happens in the middle. It combines activity from both sides of the market. You can’t just look at buyers or just sellers. They’re connected. If sellers list bad stuff, buyers leave. If buyers don’t buy, sellers quit. The system ties it all together.
So, what does this actually help you decide? Well, quite a lot.
For your product team, it answers questions like: “Where are buyers dropping off?” Maybe they add to cart but bail at shipping. The data shows you exactly where the friction is. For finance, it’s about the money. “Why did commissions change this month?” Was it a promo? A bug? A shift in high-value categories? The system tracks every cent, so you know.
And for your sellers? They want to know what works. “Which listings convert best?” Not just views, but actual sales. The system highlights their top performers so they can double down.
Which Marketplace Metrics Should You Track?
Marketplace Liquidity and Buyer–Seller Activity
Liquidity. It’s one of those words that sounds super finance-y, but in a marketplace, it just means: “Is stuff actually happening?”
If you have a thousand listings but zero sales, you’re illiquid. If you have buyers wanting to buy but no sellers, same problem. You need to measure this, but here’s the catch—there’s no one-size-fits-all metric. You’ve got to pick what fits your model.
Running a service marketplace, like freelance gigs or home repairs? Maybe booking fill rate is your best friend. How many requests actually get booked? For an e-commerce style market with physical goods, listing sell-through might be better. What percentage of listed items actually sell within a month?
In my experience, trying to force a square peg into a round hole here just leads to bad data. Pick the one that reflects value creation for your users.
But liquidity is a lagging indicator. It tells you what happened. To fix things, you need diagnostic marketplace KPIs. Two big ones:
- Buyer Conversion: Are visitors turning into buyers? If this drops, your traffic might be junk, or your checkout is broken.
- Seller Activation: Are new sellers actually listing items? If they sign up but never post, you’ve got a supply problem brewing.
Track these together. If activation is high but conversion is low, you’ve got plenty of stuff to buy, but nobody wants it. That’s a product or pricing issue, not a supply one. See the difference?
Marketplace GMV and Marketplace Take Rate
GMV (Gross Merchandise Value) is the total value of all transactions processed through your platform. It’s the top-line number. Investors love it because it shows scale.
Take Rate is how much of that GMV you actually keep as revenue. It’s usually a percentage.
Let’s break it down with a simple example. Say a seller lists a vintage jacket for $100. A buyer buys it. Your platform charges a 10% commission.
- GMV: $100
- Your Revenue: $10
- Take Rate: 10% ($10 / $100)
Simple, right? Well, sort of. The devil is in the details. What happens if the buyer returns the jacket next week? Do you subtract that from GMV? Most serious platforms do. They track Net GMV. If you don’t, your numbers look inflated, and you’ll eventually run into cash flow issues because you paid out sellers on money you had to refund.
And cancellations? Same deal. If an order is cancelled before it ships, it shouldn’t really count toward successful GMV.
Then there’s the timing. When do you report it? When the order is placed? When does it ship? When does the money hit the bank? This matters for finance teams. If you recognize marketplace GMV on placement but refunds happen later, your monthly reports will look like a rollercoaster. Consistency is key here. Pick a method—usually, recognition upon shipment or completion is safest—and stick to it.

E-Commerce Admin Dashboard Design Concept by Shakuro
How to Design the Analytics Architecture
Collect and Connect Source Data
Here’s where things can get messy real quick. You’ve got data coming from everywhere. Your app logs user clicks. Your payment processor sends webhooks. Your order management system updates statuses. If you don’t have a plan, it’s just noise.
The first step? Mapping it all to stable IDs. Not some temporary session ID that disappears after an hour. You need a consistent buyer_id, seller_id, and order_id that links everything together. If a buyer clicks on a listing, places an order, and then leaves a review, those three actions need to tie back to the same person and the same transaction. Without that link, you can’t track journey or lifetime value. It’s basic, but so many teams skip it and regret it later.
Think of the flow like this:
- Ingestion: Data hits your system via APIs or logs.
- Storage: It lands in a raw data lake or database. Don’t transform it yet. Just keep it safe.
- Calculation: This is where you clean it up. Join the buyer events with the order records. Calculate the metrics.
- Dashboard: The final output. The pretty charts your team sees.
If you mess up step one, step four is useless. Garbage in, garbage out.
Choose a Stack and Refresh Schedule
You don’t need a Ferrari to go to the grocery store. Same goes for marketplace analytics.
For an MVP, keep it simple. Really simple. You can start with scheduled imports. Maybe a nightly script that pulls data from your production DB into a separate reporting database. Use SQL to transform that data into the metrics you need. Then hook up a BI tool like Metabase or Looker. Done.
This works fine for most early-stage marketplaces. Why? Because you probably don’t need real-time data. Knowing your GMV from yesterday is usually enough to make decisions today.
But when do you upgrade? Well, a few signs tell you it’s time:
- Volume: Your queries are taking minutes to run because you have millions of rows.
- Latency: Product managers are complaining they can’t filter data quickly.
- Freshness: You’re running a flash sale and need to see results every 15 minutes, not every 24 hours.
That’s when you look at a proper data warehouse (like Snowflake or BigQuery) or pre-aggregated tables. Maybe even streaming if you’re doing high-frequency trading or live auctions. But honestly? Don’t over-engineer it early. Start with the nightly SQL job. It’s boring, but it works.
Protect Access to Seller Data
This is non-negotiable. In a marketplace, data isolation is trust. If Seller A can see Seller B’s sales numbers, you’re done. Game over.
It’s not just about hiding columns in a marketplace seller dashboard. You need server-side scoping. Every single query that fetches seller data must include a check: WHERE seller_id = current_user.seller_id. No exceptions.
And don’t forget admin roles. Your support team might need to see all data to help with disputes, but your marketing intern shouldn’t. Set up strict role-based access control (RBAC).
How do you know it works? Test it. Write a test case that logs in as Seller A and tries to fetch order details for Order #123, which belongs to Seller B. The system should return a 403 Forbidden error. If it returns any data, you’ve got a security hole. Patch it immediately.
Also, keep audit logs. Who accessed what and when? It feels like overhead, but when something weird happens, you’ll be glad you have that trail. It’s a little annoying to set up, sure, but sleeping well at night is worth it.
What Should a Marketplace Dashboard Include?
Operator Dashboard
This is your command center. The place where you, as the founder or ops lead, spend your morning coffee time. But here’s the trap: it’s easy to clutter this thing up with every metric under the sun. Don’t do that.
You need clarity. For example, a dashboard we did for Owari. We did a great job of handling dense data without making it feel overwhelming. It’s all about modularity. You want blocks of information that you can rearrange or ignore depending on what you’re focusing on that day.
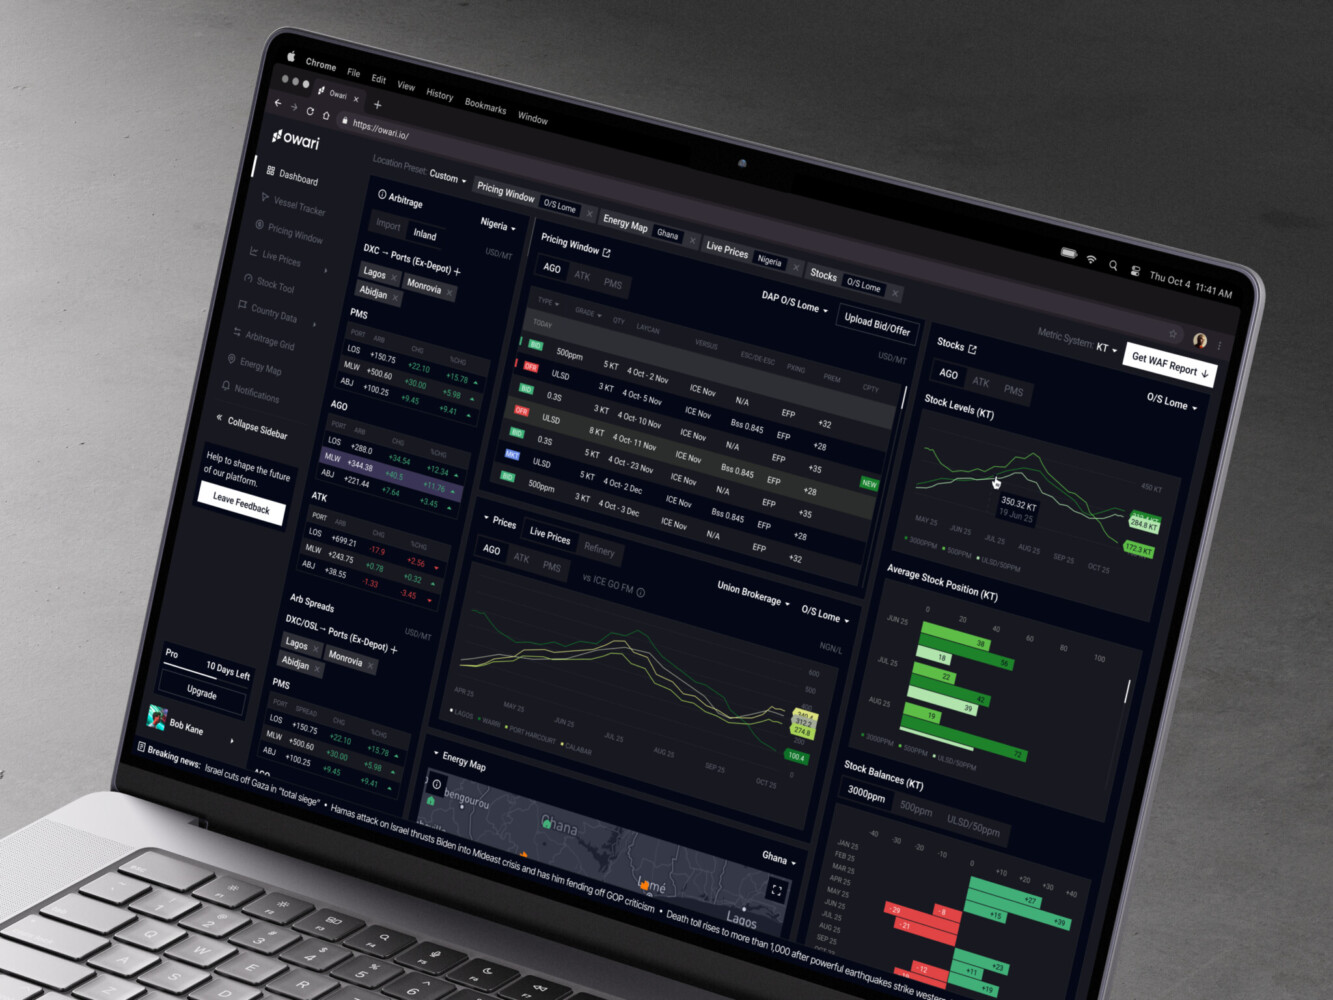
Owari dashboard by Shakuro
So, what goes in there? First, marketplace KPI trends. Not just today’s numbers, but how they compare to last week or last month. Is GMV up? Is liquidity dipping? A simple line chart does the trick.
Second, filters. You need to slice and dice. Maybe sales are down overall, but they’re actually up in the “Electronics” category in “New York.” If you can’t filter by category, region, or seller tier, you’re missing the story behind the numbers.
And finally, the ability to drill down. This is huge. You see a spike in refunds. Why? You click on the number, and it takes you to the list of orders. You click an order, and you see the details. Who bought it? From whom? When? Without this, you’re just staring at a problem you can’t fix. It’s like having a warning light in your car but no mechanic to tell you what’s broken.
Marketplace Seller Dashboard
Now, flip the script for analytics dashboard development. This isn’t for you. It’s for the people who make your marketplace happen: the sellers.
The seller dashboard isn’t just a data dump; it’s a tool for running a business. Sellers don’t care about your total platform GMV. They care about their store.
What do they need to see immediately?
- Listing Performance: Which items are getting views? Which ones are actually selling? If a listing has 1,000 views and zero sales, maybe the price is too high. The dashboard should highlight this.
- Orders: A clear list of what needs to be shipped or completed. Statuses matter here. “Pending,” “Shipped,” “Delivered.” Keep it simple.
- Refunds: Nobody likes them, but sellers need to track them. Did a buyer return an item? Why? This affects their bottom line.
- Payouts: The most important part. When are they getting paid? How much is pending? How much has been transferred? Transparency here builds trust. If sellers feel like you’re hiding their money, they’ll leave.
It’s about context. A multi-vendor storefront means every seller is running their own mini-business inside your platform. Your marketplace dashboard should feel like their own private office, not a public bulletin board. Make it clean, make it relevant, and make sure the payout numbers are accurate. Nothing kills vibe faster than a wrong dollar amount.
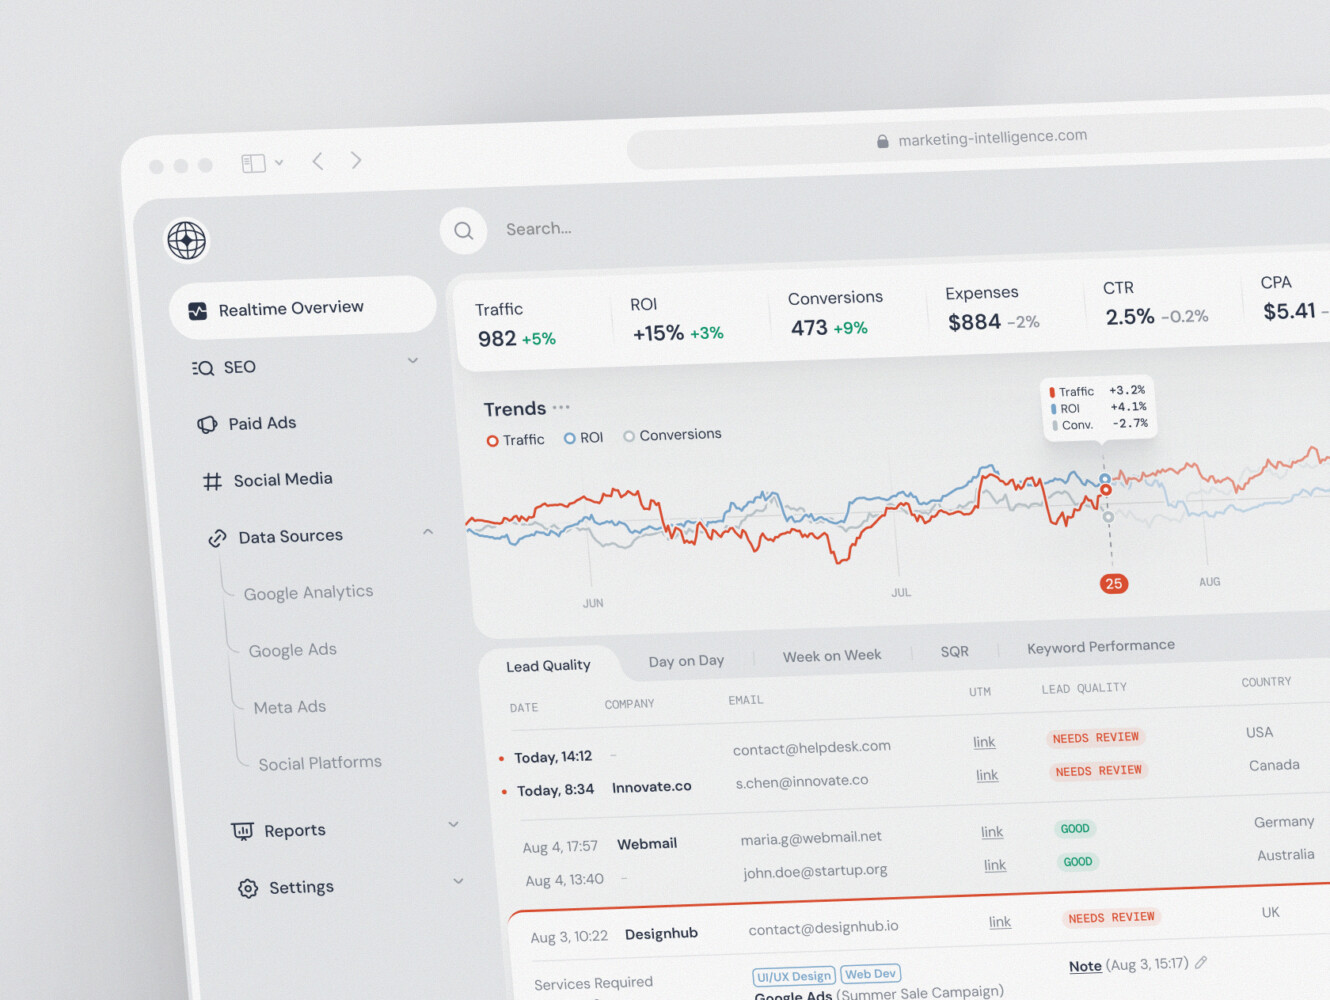
SaaS marketing dashboard by Conceptzilla
How to Build and Launch the System
So, how do you actually get this thing off the ground without losing your mind? It’s tempting to just start coding, but trust me, a bit of planning saves you from a world of hurt later.
1. Define the Decisions and Agree on Formulas
Before you write a single line of SQL, sit down with your team. What decisions does the MVP need to support? Maybe it’s just “Are we growing?” and “Who are our top sellers?” Keep it small. And here’s the kicker: agree on the formulas. What exactly counts as “active”? Is GMV recognized on the order date or payment date? If Finance and Product have different definitions, your dashboard will be useless. Write it down. Sign off on it. It sounds bureaucratic, but it prevents arguments later.
2. Prototype the Views
Don’t build the whole backend yet. Sketch out the admin and seller dashboards. Focus on their most frequent tasks. For an operator, that’s probably checking daily sales and spotting anomalies. For a seller, it’s seeing today’s orders and pending payouts. Use a tool like Figma or even just paper. Get feedback early. If the layout doesn’t make sense on paper, it won’t make sense in code either.
3. Connect Sources and Backfill
Now, get your hands dirty. Connect your order database and your payment processor (like Stripe). But don’t just start from today. You need history. Backfill at least a few months of data. Why? Because trends mean nothing without context. You can’t see a “month-over-month” increase if you only have three days of data. It’s a bit of a grind, but it’s necessary.
4. Build Calculations on the Same Data
Here’s a pro tip: use the same reporting dataset for all your metrics. Don’t have one script for marketplace GMV and another for user count that pulls from different places. Keep it unified. Build your SQL transformations or Python scripts to clean and join this data. Then, point your BI tool or custom dashboard at this single source of truth. Consistency is key.
5. Reconcile and Test
This is the boring part that saves your reputation. Take a sample order. Follow it through the system. Did the order record match the payment webhook? Check the Stripe documentation—they’re pretty good about explaining event types. Look for duplicates. Webhooks can fire twice. If you count them both, your numbers are wrong. And test those seller permissions again. Log in as Seller A and try to see Seller B’s data. It should fail. Every time.
6. Pilot and Monitor
Don’t launch to everyone at once. Pick one operator team and a handful of trusted sellers. Let them use it. Watch what breaks. Monitor data freshness—is the dashboard updating when it should? Are there reconciliation failures? You’ll find bugs. You’ll find edge cases you never thought of. That’s normal. Fix them, tweak the views, and then you’re ready to go wider.
How Much Does Marketplace Analytics Development Cost?
The cost varies wildly depending on what you’re building. It’s not just about coding; it’s about complexity, roles, and how fast you need the data. Let’s break it down into three tiers.
1. The Internal Reporting MVP
This is the “keep the lights on” version. You’re building basic dashboards for your internal team. Maybe just GMV, user growth, and simple marketplace liquidity metrics. No seller-facing stuff yet.
- One-time implementation: You’re looking at a few weeks of work for a data engineer or a full-stack dev who knows their way around SQL. Using general BI dashboard benchmarks, like those from Shakuro’s guide, a basic setup can range from $5k to $15k depending on the region and expertise. It’s mostly about connecting your DB to a tool like Metabase or Redash.
- Ongoing costs: Low. Mostly server costs for the reporting DB and the BI tool license (if you’re not using the open-source version). Maybe $100–$300 a month.
2. The Multi-Role System with Seller Reporting
Now we’re getting serious. You’re adding seller dashboards. This means data isolation, permissions, and a whole new set of metrics (payouts, listing performance). The UI needs to be polished because sellers are judging your platform by it.
- One-time implementation: This jumps up. You need frontend work for the seller views, backend logic for scoping data, and more complex ETL pipelines. Expect $20k to $50k+. You’re essentially building a product within a product.
- Ongoing costs: Higher. More compute power for handling queries from hundreds or thousands of sellers. Plus, you might need a dedicated person to handle support tickets when a seller says, “My numbers look wrong.” Budget $500–$1,000 a month for infrastructure and maintenance.
3. The Enterprise System
This is for the big leagues. You’ve got tight freshness requirements (near real-time), multiple integrations (ERP, CRM, advanced fraud tools), and maybe even predictive analytics. You’re likely moving to a cloud warehouse like Snowflake or BigQuery.
- One-time implementation: Sky’s the limit. $100k+. You’re hiring specialists, maybe a data architect, and building custom streaming pipelines. It’s a major engineering project.
- Ongoing costs: Significant. Cloud warehouse costs can spiral if you’re not careful with query optimization. Plus, licensing for enterprise BI tools like Tableau or Looker. Easily $2k–$5k+ a month, sometimes much more depending on volume.
So, where should you start analytics dashboard development? Unless you’re already scaling rapidly, stick to the MVP or the multi-role system. Don’t build an enterprise beast when a simple SQL job will do. It’s easy to overspend on analytics before you even know which metrics matter most. Start small, prove the value, then scale. It’s smarter, and frankly, less stressful.
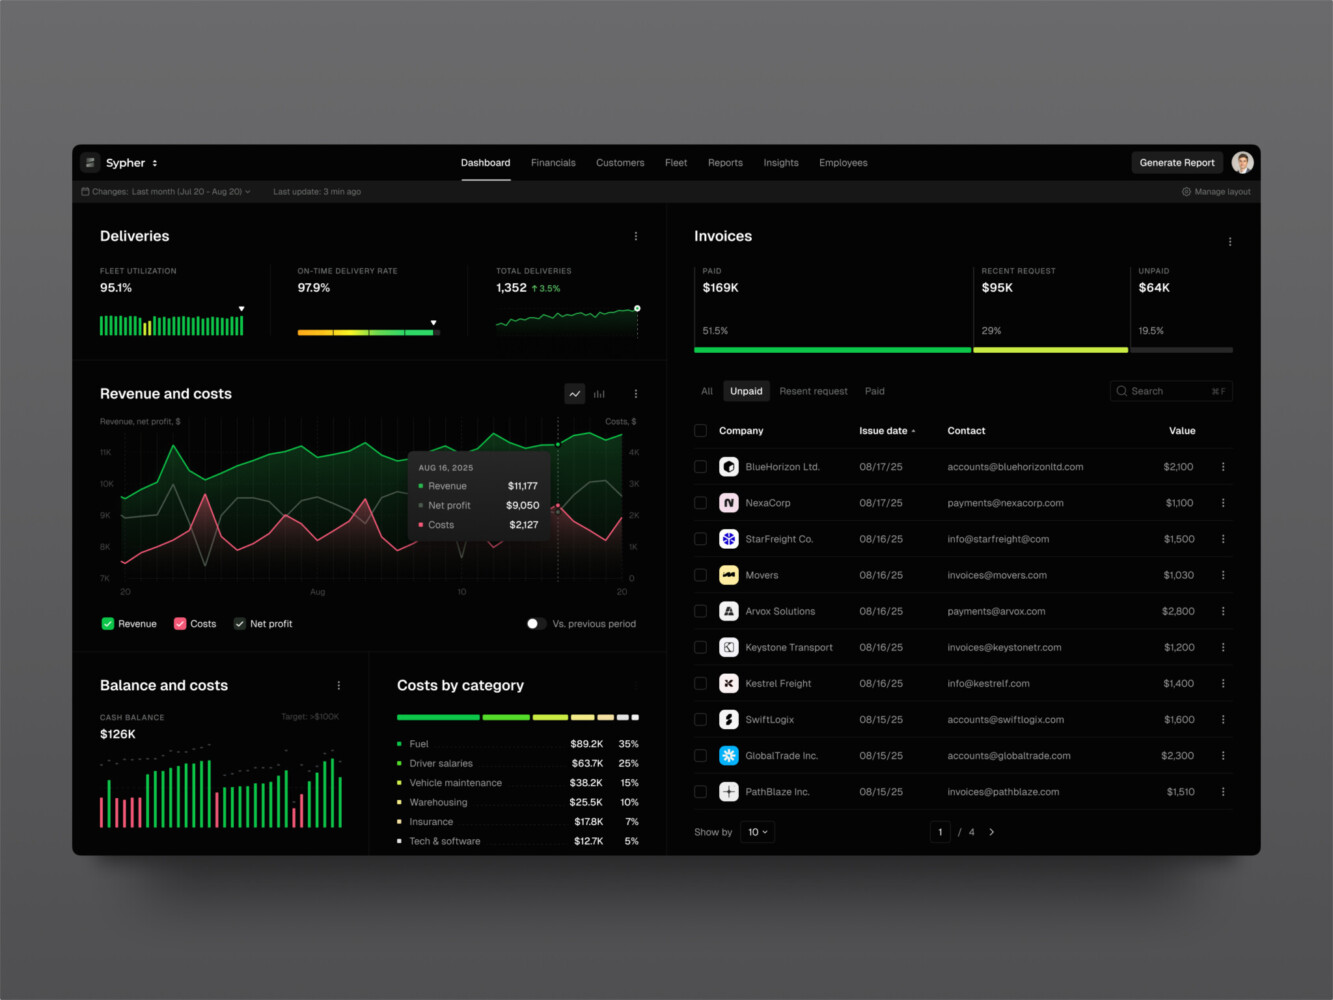
SaaS analytics platform by Shakuro
Common Problems and How to Prevent Them
Duplicate Events and Deduplication
Webhooks are notorious for this. Stripe might send you the same payment_success event twice because of a network glitch. If you’re not careful, you’ll count that sale twice. Your GMV looks great, but your bank account doesn’t match. It’s a classic rookie mistake.
The Control: Use idempotency keys. Every event should have a unique ID. Before you process it, check your database: “Have I seen this ID before?” If yes, ignore it. If no, process it and save the ID. Simple, but it saves you from a lot of headaches.
Late Refunds and Reconciliation
Refunds don’t always happen instantly. A buyer might return an item two weeks later. If your system only looks at today’s transactions, you’ll miss it. Then your finance team comes knocking, asking why the payout report doesn’t match the bank statement.
The Control: Build a reconciliation job that runs daily or weekly. It shouldn’t just look at new orders; it should re-check recent periods for updates. Compare your internal ledger with your payment processor’s report. If there’s a mismatch, flag it. Don’t wait for someone to notice.
Inconsistent KPI Definitions and Shared Calculations
This is the silent killer. Marketing says “Active User” means someone who logged in. Product says it means someone who made a purchase. Finance says it’s someone who generated revenue. If everyone is using different logic, your meetings become arguments about definitions instead of decisions.
The Control: Centralize your metric logic. Don’t let each dashboard calculate GMV its own way. Create a single “metrics layer” or a set of shared SQL views. Everyone queries from the same source. If you change the definition of “Active,” you change it in one place, and it updates everywhere. Document it, too. Write it down so new hires don’t guess.
Slow Drill-Downs and Pre-Aggregation
You click on a number to see the details, and… you wait. And wait. Five seconds? Ten? In a modern app, that’s an eternity. Users will just give up. This usually happens when you’re trying to calculate complex metrics on the fly from millions of raw rows.
The Control: Pre-aggregate your data. Instead of calculating “monthly sales per category” every time someone loads the dashboard, calculate it once a night and store the result in a summary table. When the user drills down, they’re querying a small, fast table, not the entire history of your marketplace. It’s a trade-off—your data isn’t real-time—but for most historical analysis, it’s worth it for the speed.

What to Build First
So, where do you actually start? It’s easy to get paralyzed by the possibilities. Do you build seller dashboards first? Or maybe a fancy real-time feed for investors? Don’t.
Start creating a marketplace analytics system with the backbone. If you don’t trust your basic numbers, nothing else matters. Your first release should be boringly practical. Focus on three things: order data, payment data, and getting them to agree.
Build a scoped MVP that does just this:
- Ingest orders and payments. Get the raw records from your app and your payment processor (like Stripe) into one place.
- Agree on GMV and Take Rate. Stop debating it in meetings. Write down the formula. Does GMV include tax? What about shipping? Decide once, code it once, and stick to it.
- One Operator Dashboard. Just one. For your internal team. It should show daily sales, net revenue, and maybe a simple liquidity metric. But here’s the key: it must be reconciled. You should be able to pick a random day, look at the dashboard, look at your Stripe account, and see the same number. If they match, you’ve won.
This is where having the right partner helps. At Shakuro, we don’t just throw code at the wall. We focus on integrating those messy data sources cleanly and designing reporting workflows that actually make sense for your operators. We help you bridge the gap between “we have data” and “we can use this data.”
It’s about building the right thing first. Once you trust the foundation, you can add the seller views, the advanced filters, and the pretty charts. But until then? Keep it simple.
Ready to stop guessing and start knowing? Tell us about your marketplace. Let’s figure out what matters most for your specific model.
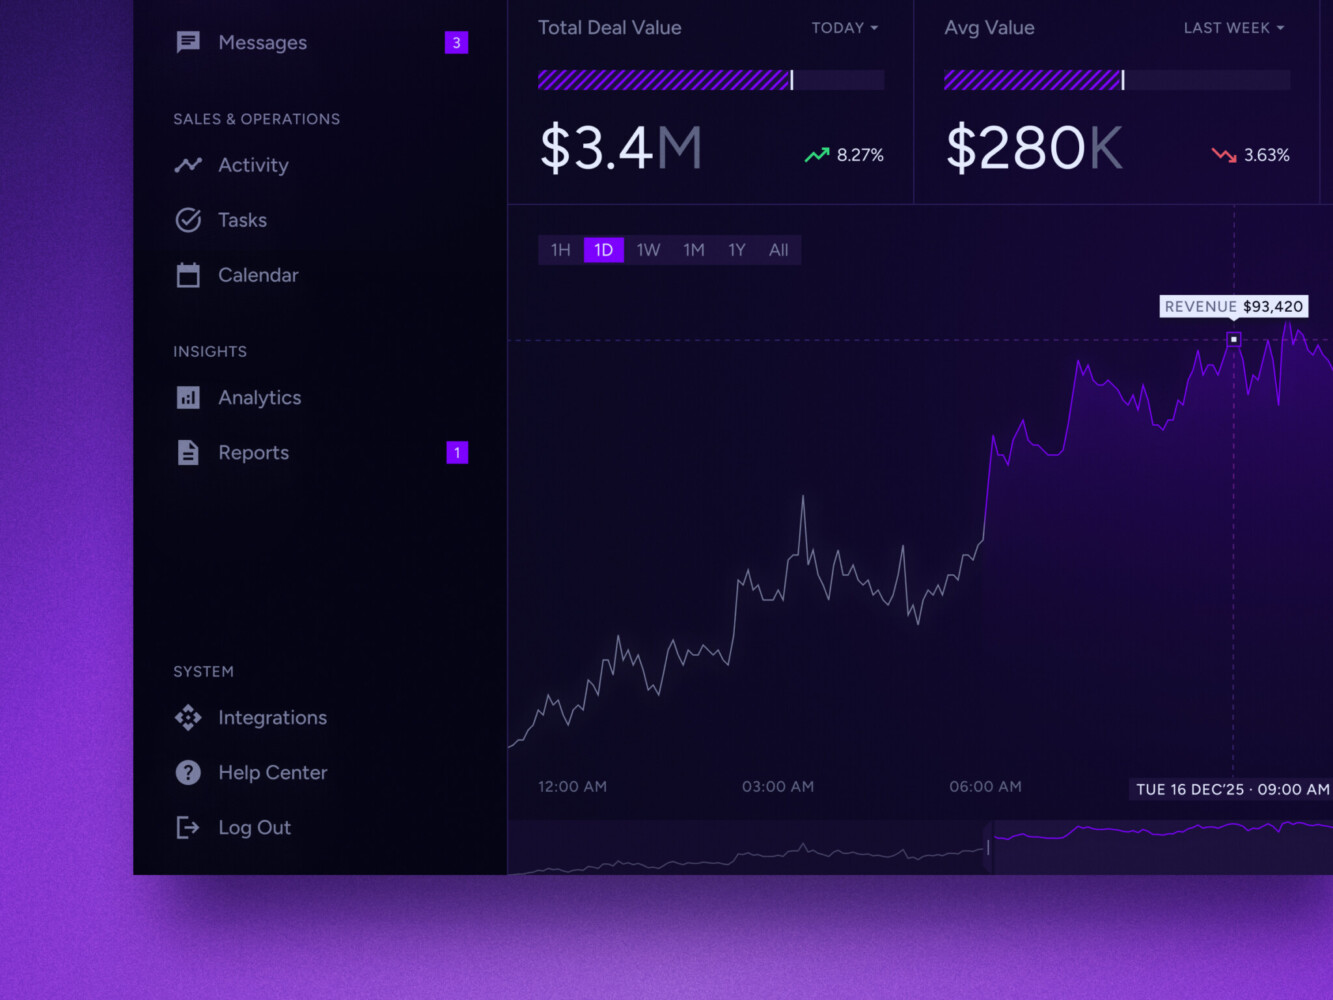
Real-time data dashboard by Shakuro
FAQ
Which marketplace KPIs should an MVP track?
Keep it simple. Track GMV, Take Rate, and Liquidity (like fill rate or sell-through). Maybe add Buyer Conversion and Seller Activation if you’re trying to diagnose growth issues. Don’t overcomplicate it early on.
How do partial refunds affect marketplace GMV and take rate?
They lower both. If a $100 order gets a $20 refund, your Net GMV drops to $80. Your commission (and thus revenue) usually drops proportionally unless you have a non-refundable fee structure. Always track Net GMV to stay honest with yourself.
When does a marketplace dashboard need real-time updates?
Honestly? Rarely. Most decisions can wait 24 hours. You only need real-time if you’re running live auctions, flash sales, or high-frequency trading where seconds matter. For most marketplaces, daily freshness is plenty. Save the engineering headache.
Which data should a marketplace seller dashboard show?
Focus on their business. Show listing performance (views vs. sales), current orders needing action, refund history, and payout status. They don’t care about your platform-wide metrics; they care about their wallet and their inventory.