
For those who prefer to listen rather than read, this article is also available as a podcast on Spotify.
Contents:
Measuring the ROI of web design sounds straightforward until you actually try to do it. Traffic goes up. The bounce rate goes down. The site “looks better.” Stakeholders are happy. But when the conversation turns to revenue impact, pipeline influence, or real business growth, design is often reduced to a supportive role instead of being treated as a measurable growth asset.
In reality, knowing how to measure ROI of web design requires moving past surface indicators and building a system of web design ROI metrics that reflect how design changes user behavior, decision-making, and ultimately financial outcomes.
Why Measuring ROI of Web Design Is Harder Than You Think
Most teams still evaluate design through cosmetic or isolated performance indicators: visual quality, page speed, awards, or even raw conversion rate changes after a redesign. These signals are easy to capture, but they rarely describe the real contribution design makes to a product or business.
The core difficulty is that web design almost never operates as a single-variable experiment. A new interface usually ships alongside new messaging, new functionality, revised funnels, and technical changes. Traffic sources evolve. Sales processes shift. Market conditions change. When revenue grows, it is rarely obvious which portion of that growth is attributable to design decisions rather than to marketing spend, pricing, or product updates.
Another layer of complexity is that design often works indirectly. It reduces friction, clarifies value, increases perceived trust, and shortens decision cycles. These effects show up across the entire user journey, not just on a single landing page. That is why teams who only look at “before and after” conversions often miss how deeply design influences retention, expansion revenue, and sales efficiency. This is especially visible in conversion-focused design approaches, where visual structure, interaction patterns, and information hierarchy quietly reshape how users move through the product and why they decide to stay or buy.
There is also a time factor that distorts measurement. Some design changes create immediate lifts in sign-ups or demo requests. Others work slowly by improving onboarding, product clarity, or brand credibility, which later affects churn, lifetime value, and deal size. If ROI tracking is limited to the first few weeks after launch, a large part of the real business impact never enters the analysis.
Finally, web design outcomes are often distributed across teams. A better design may reduce support load, increase sales close rates, improve ad efficiency, or raise partner trust, none of which appear inside standard design dashboards. When ROI frameworks are too narrow, design ends up being evaluated on convenience metrics instead of business ones.
This is why measuring web design ROI is less about finding a single “design KPI” and more about building a structured model that connects design changes to behavioral shifts, and behavioral shifts to commercial results.
The Right Metrics to Measure Web Design ROI
Web design ROI only makes sense when it is measured in business terms. A redesign is not an achievement on its own. It becomes one only if it changes how people behave and, as a result, how the business performs.
In practice, this means metrics have to follow a simple sequence: how people use the site, what actions they take, and what financial result those actions bring. When these layers are disconnected, conclusions are usually wrong. Engagement without outcomes is noise. Conversions without revenue context hide quality problems. Revenue without behavioral data makes it impossible to understand what actually influenced growth.
A workable ROI model always links these three levels.
User Engagement Metrics (Not Just Bounce Rate)
Design starts working long before a user becomes a lead or a customer. It works when someone scrolls, opens sections, compares options, looks for proof, or tries to understand what is being offered. These moments rarely appear in revenue reports, but they are where most design decisions either help or fail.
Session duration matters when it reflects real reading, comparison, and exploration. When structure and hierarchy improve, people usually spend more focused time on relevant pages because they can actually follow the logic of the site.
Pages per session shows whether navigation supports that logic. Growth here is meaningful when users move through connected content: from problem to solution, from solution to examples, from examples to action. When this number grows without pattern, it often signals confusion, not interest.
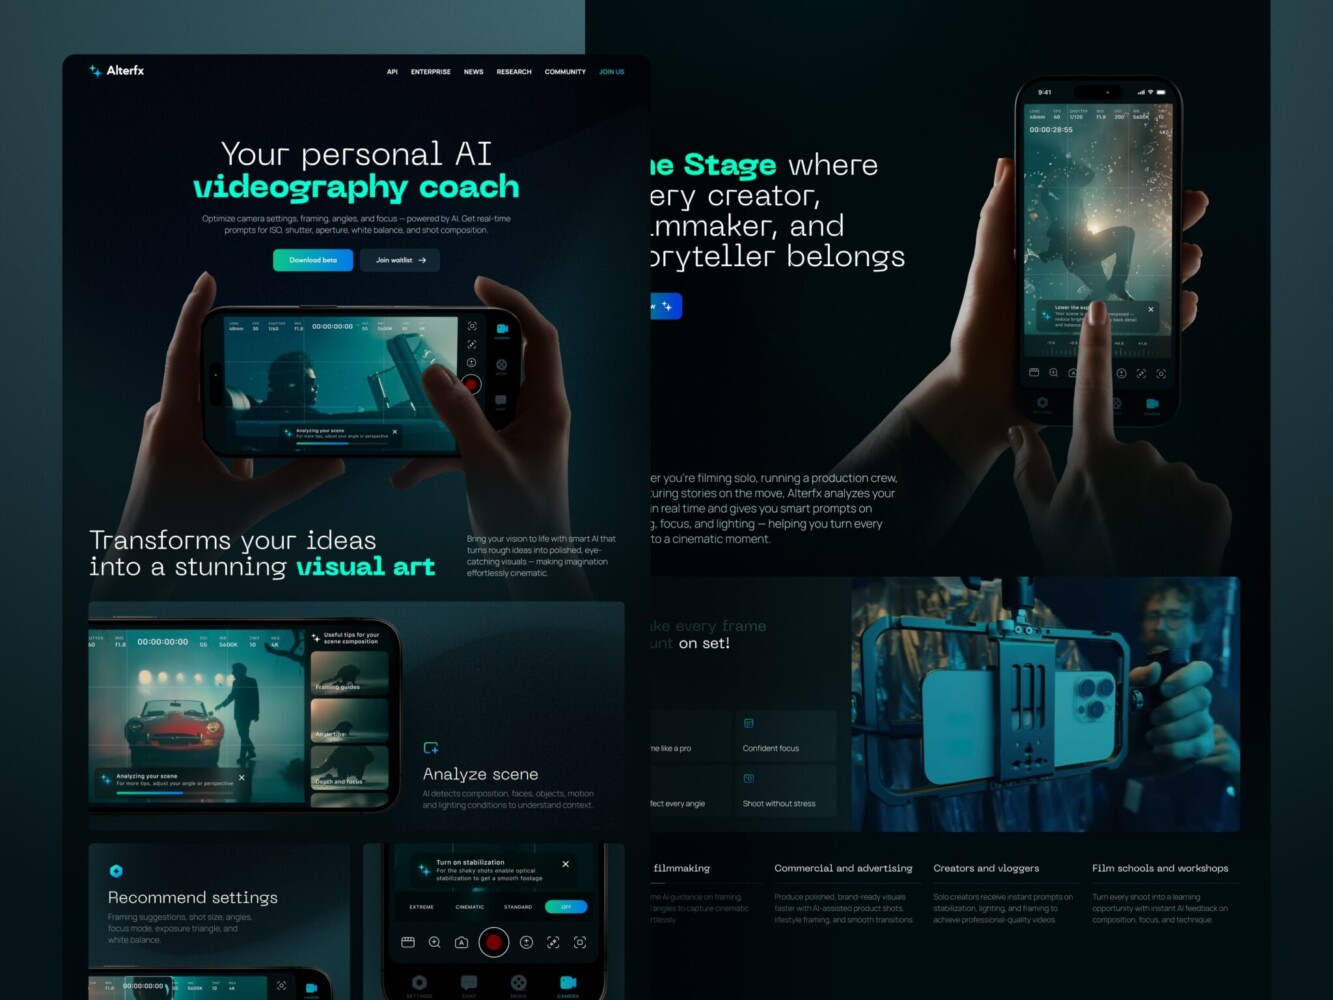
Landing Page for AI Video Production Platform by Shakuro
Interaction data is often more useful than both. Scroll depth, feature clicks, pricing toggles, filter usage, video views, and internal navigation show whether the interface helps people make sense of what they see. These signals are usually the first place where design impact becomes visible.
Engagement also reacts quickly to layout and performance changes. Visual stability, loading behavior, and page structure directly affect whether users interact at all. That is why teams often see behavioral shifts after design work that improves page speed and conversions, even before sales metrics move.
Engagement metrics don’t show ROI. They show whether design has created the conditions for it.
Conversion Metrics (Leads, Demos, Signups)
Conversions are the first clear business checkpoint.
For B2B and service companies, this is lead activity: demo requests, contact forms, consultations, or inbound inquiries. Design influences how visible these actions are, how natural they feel in the journey, and whether users trust the page enough to submit their details. A redesign can keep lead volume flat and still change business results if it improves lead quality, which is why conversion data should never be reviewed without sales feedback.
For SaaS products, the main signal is account creation or trial starts. Here, design works through clarity and friction. Form structure, page sequencing, feature explanation, and onboarding cues often determine whether interest turns into real usage.
Beyond the first signup sit paid plans, upgrades, and feature adoption. At this stage, design supports continuity rather than attraction. It shapes how users understand value, compare options, and decide to invest further. Measuring these actions usually gives a much more realistic picture of design impact than top-of-funnel conversion rates.
Conversion metrics answer one question: did the new design make it easier for people to take commercially meaningful actions?
Revenue Metrics (LTV, CAC)
Revenue is where design finally becomes visible to the business.
Customer acquisition cost shows how efficiently traffic turns into paying users. When design improves clarity, trust, and usability, more visitors convert from the same channels. Over time, this lowers CAC without increasing marketing spend.
Lifetime value reflects what happens after the first transaction. Onboarding quality, product usability, and perceived reliability are all strongly influenced by design. When these improve, retention grows, support load often drops, and expansion revenue becomes easier to generate.
Average revenue per user adds another layer. Interface changes in pricing, packaging, or upgrade flows can raise how much customers spend even if traffic and signup volume stay the same.
When revenue metrics are tied back to engagement and conversion behavior, design stops being judged as a visual update and starts being evaluated as a factor that reshapes how the business earns money.
The Link Between Web Design and Conversion Rate
Conversion rate is the first place where the effect of design becomes visible in numbers.
Layout, spacing, typography, and interface logic directly affect how quickly people understand a page and whether they feel comfortable acting on it. What users see first, how information is grouped, and how the path forward is built all influence whether they continue or leave.
When conversion changes after a redesign, the reason is usually concrete. The product is easier to understand. Key information appears earlier. Steps feel simpler. Forms ask less. Pages answer doubts sooner. Conversion moves when the site stops forcing users to work.
This link between design, trust, and conversion is especially visible in products built around complex data.
Hyphen, a Swiss climate-tech company working on real-time carbon monitoring, faced exactly this problem. Their platform is based on atmospheric measurements and automated verification of carbon credits. The technology was strong, but the way it was presented made it hard for new users to quickly understand what the product actually did and why it could be trusted.
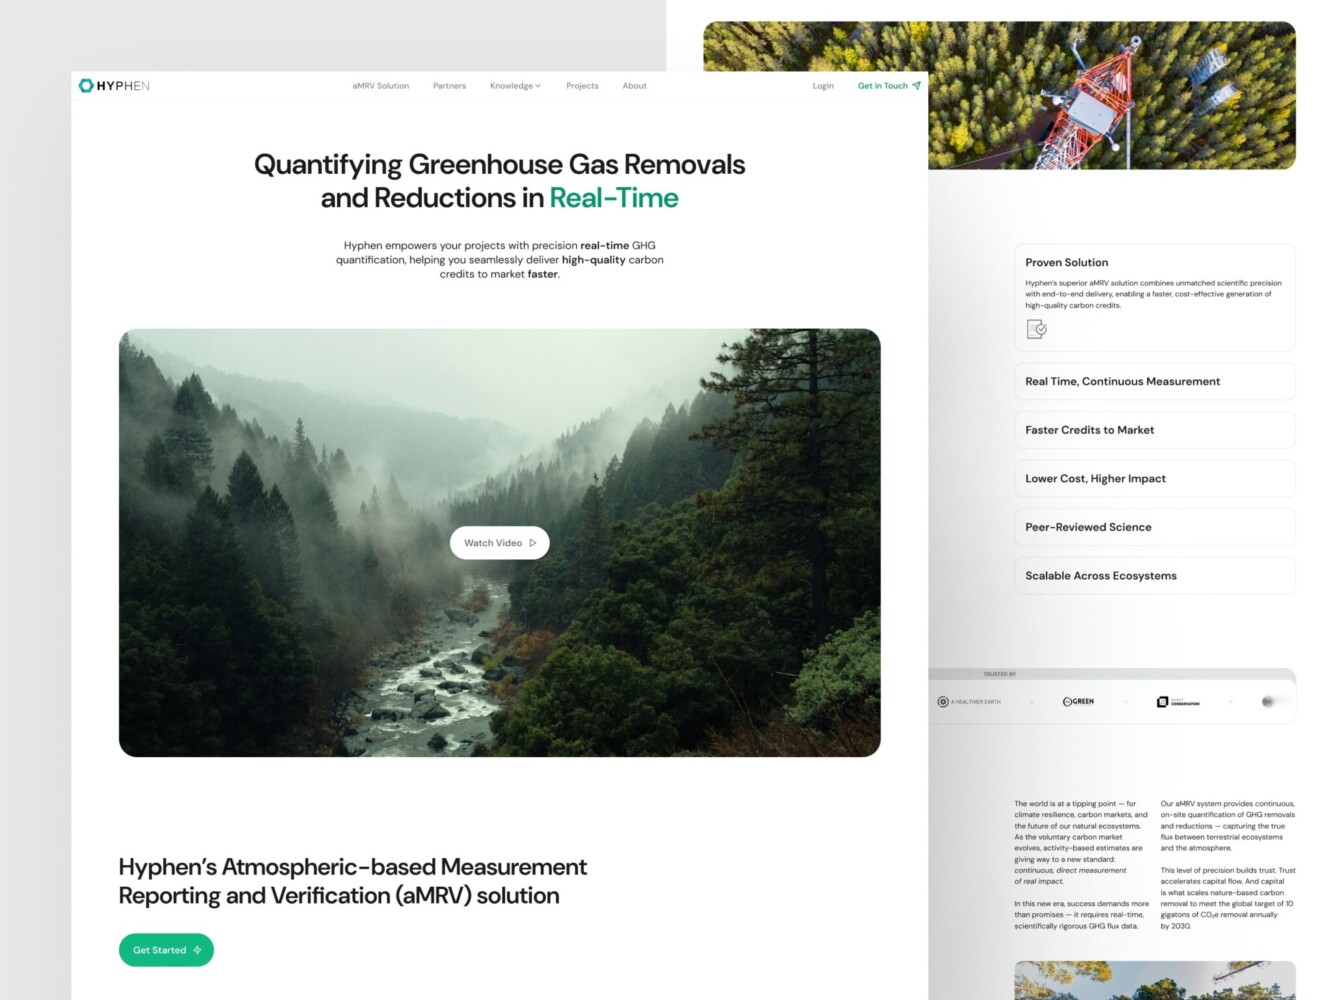
Design for a Carbon Measurement and Verification Company by Shakuro
During the redesign, the focus was not on “updating the look,” but on reorganizing how the product explains itself. The structure of the platform was rebuilt so that context comes before detail. Key pages were redesigned around clear data hierarchy, visible workflows, and custom visual explanations of how measurements are collected and turned into usable results. Instead of long technical descriptions, the interface began showing the logic of the system.
For a product like Hyphen’s, this kind of design work directly affects conversion. When people can see how a system works and where its data comes from, hesitation drops. Understanding grows. And the decision to engage stops being a leap of faith and becomes a reasoned choice.
How Design Affects Trust and User Behavior
Users form an opinion about credibility almost instantly. They react to order, balance, visual consistency, and stability. Interfaces that look fragmented, overloaded, or careless raise doubt even if the offer is strong. Interfaces that feel structured and intentional reduce it.
Navigation and page logic then shape behavior. Clear menus and predictable sections reduce wandering. Well-grouped content speeds up scanning. Collapsible blocks and step-by-step disclosure prevent overload. When users don’t have to decode the interface, they move more confidently through it.
Calls to action depend on context. A button works when it appears after the information needed to make a decision. Design controls this order. It decides what is seen first, what supports it, and where the action sits. When this sequence is wrong, CTAs feel intrusive. When it is right, they feel expected.
Consistency connects everything. Repeating layouts, familiar components, and stable interactions lower the mental effort required to use the site. That freed attention goes into evaluating the product itself. This shift is often what shows up later as higher conversion.
A/B Testing with Design Variations (The Right Way)
Design tests rarely help when they focus on decoration. Color swaps and small visual tweaks can change numbers, but they don’t explain much and rarely improve the product.
More useful tests change structure. They test different content order, different page composition, different ways of presenting features, pricing, or proof. The goal is not to “refresh” a page but to see whether another layout makes the decision process clearer.
Good tests usually start from a diagnosed problem: users miss key information, abandon forms, get lost in long pages, or fail to understand value. Variants then restructure those areas: splitting pages, regrouping sections, staging forms, or reworking how evidence is shown.
Results only become meaningful when they are followed beyond the first step. A variant that increases sign-ups but lowers activation or raises early churn damages ROI. Tracking what happens after conversion—onboarding, early usage, retention—is what separates design testing from interface gambling.
How to Connect Web Design to Business Outcomes
Web design only makes sense in business terms when it is observed over time. Launch metrics almost always distort reality because traffic composition changes, campaigns interfere, and product decisions overlap with interface updates. What matters is how user behavior evolves after changes are introduced and how those behavioral shifts later appear in commercial indicators.
In everyday work, this means watching how people move through key pages, where they interrupt processes, what actions they complete, and how those actions continue into sales pipelines, subscriptions, or active product use. When design is treated as part of ongoing site operations rather than a one-off project, its influence becomes much easier to see.
From KPIs to Metrics: Translating Design Decisions
Design becomes measurable when it is anchored to a concrete business problem. High cart abandonment, weak demo request flow, or low activation after signup already describe both the issue and the part of the interface where it lives.
Checkout problems are reflected in step exits, error frequency, completion time, and payment failures. Demo performance is reflected in product page depth, call-to-action engagement, form starts, and successful submissions. Activation problems surface in onboarding completion, first meaningful actions, and early feature usage.
Once these links are established, design work stops being about visual preference and starts being about removing specific obstacles. Page structure, navigation, content sequencing, and interaction logic are adjusted to influence particular behaviors, not to “refresh” the interface.
This approach also protects teams from misleading improvements. Longer sessions without better checkout completion do not solve a revenue problem. Higher demo volume without sales progression often signals misalignment rather than growth. Return on design investment appears only when the original business constraint shifts.
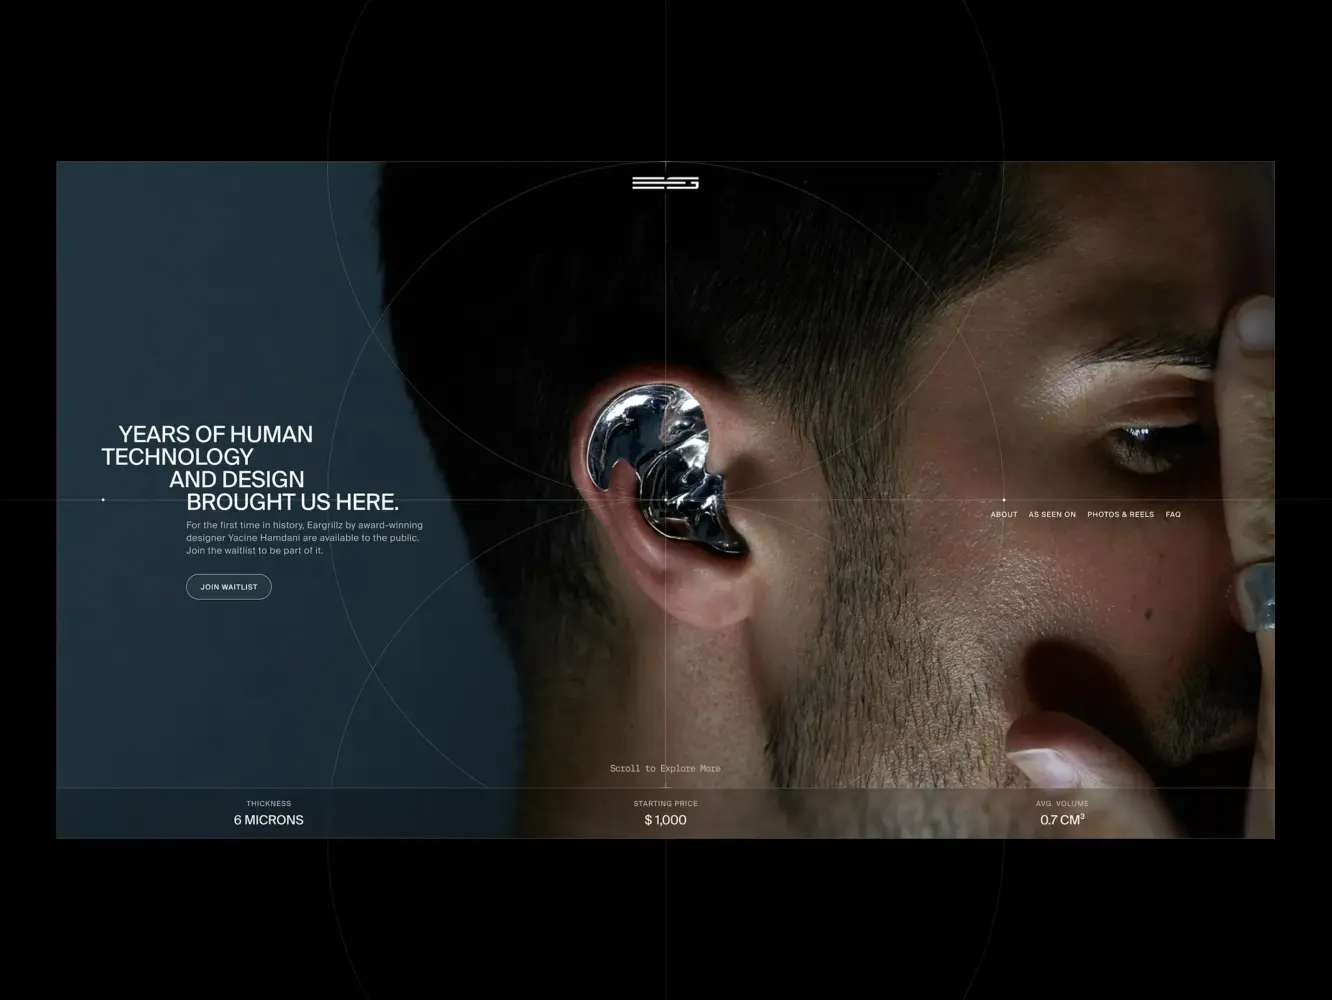
Landing Page for Avant-Garde Jewelry Product by Shakuro
Using Google Analytics and Heatmaps to Measure Design Impact
Analytics systems provide the behavioral outline. They show where people enter, which paths they take, where they exit, and which actions they complete. Over time, these patterns reveal whether users reach important sections more often, move through funnels more smoothly, or drop out at different stages.
Heatmaps and session recordings provide the texture. They show what attracts attention, which areas are skipped, where users hesitate, and how they attempt to interact with elements. They make visible the issues that raw numbers cannot explain, such as ignored blocks, misplaced actions, misleading visuals, or disrupted reading flow.
When these two sources are used together, changes become interpretable. A decline in form completion can be reviewed against real recordings. A shift in exits can be compared with scroll behavior. A rise in pricing page abandonment can often be traced back to layout or information order.
Over longer periods, this kind of observation replaces post-launch reporting with continuous evaluation, where individual design decisions can be followed from interface change to behavioral shift to business result.
Avoid Vanity Metrics: What Not to Track
Web design ROI is often distorted not by missing data, but by the wrong data being emphasized. Some numbers are easy to report and easy to celebrate, yet say very little about whether a site has actually become more effective. In design work, these are usually surface indicators that move quickly but rarely explain changes in user decisions or business results.
The risk is not in tracking them, but in stopping there. When these metrics are treated as outcomes rather than signals, teams end up with positive-looking reports that fail to show whether design improvements solved any real problem.
Page Views, Without Context
Page views are one of the most misleading examples.
A growing number of views can mean that marketing campaigns intensified, search visibility improved, or referral traffic increased. It can also mean that users are opening more pages because they cannot find what they need. On their own, page views do not indicate interest, clarity, or progress.
For design evaluation, this metric only becomes meaningful when it is read alongside navigation paths and subsequent actions. An increase in product page views matters when it is followed by deeper feature exploration, demo requests, or trial starts. An increase in help center views matters when it coincides with smoother onboarding or fewer support requests. Without that link, page views only show volume, not effectiveness.
Design should be assessed on whether it helps people reach relevant information faster and move forward with fewer obstacles, not on whether it increases the raw number of pages opened.
Time on Site vs Engagement
Time on site is often treated as proof of interest, but in practice it is ambiguous.
People spend more time when they are engaged, but they also spend more time when they are confused, forced to search, or repeatedly returning to the same sections to understand them. In many redesigns, longer sessions appear precisely because flows are unclear or information is scattered.
For design ROI, what matters is not how long users stay, but what they manage to accomplish. A shorter visit that ends with a completed request, a clear product comparison, or a finished checkout is usually more valuable than a long visit filled with scrolling and backtracking.
Session duration only starts to support conclusions when it is viewed together with interaction depth, task completion, and funnel movement. When time grows and users also complete more relevant actions, discover key content, and progress through decision stages, the metric supports a positive reading. When time grows without these signals, it more often points to unresolved layout, navigation, or content problems.
Avoiding vanity metrics does not mean ignoring them. It means refusing to treat them as evidence. Design ROI is reflected not in how much activity a site accumulates, but in how consistently that activity turns into meaningful outcomes.
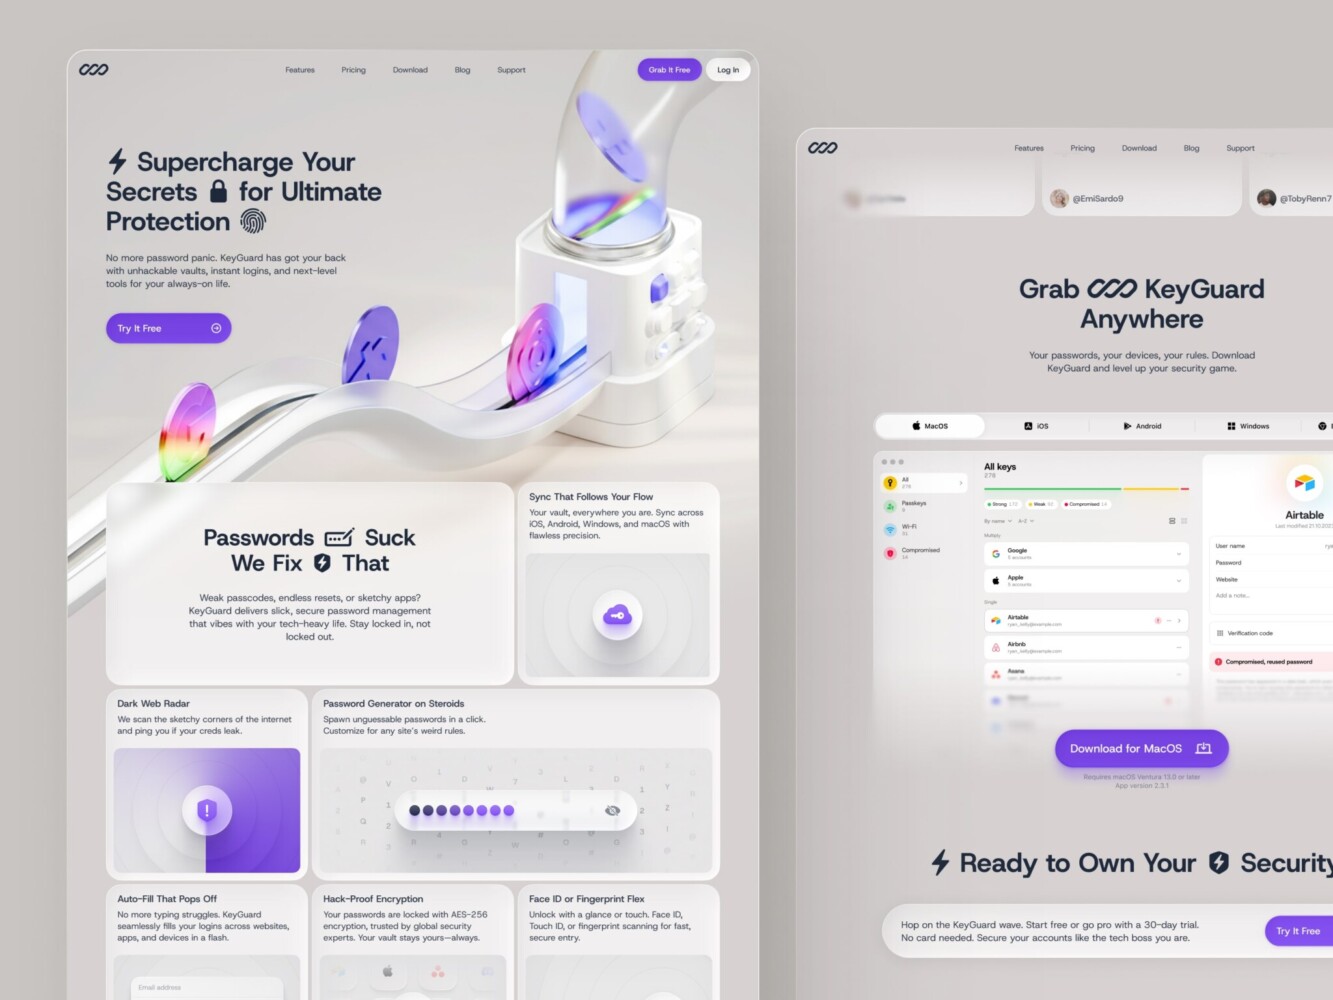
Landing Page Design for Password Manager by Shakuro
Tracking Design Impact on Customer Retention
Web design starts to matter most after the first visit. People can arrive for many reasons that have nothing to do with the interface. They stay for much simpler ones: the site is clear, actions are easy, and nothing gets in the way.
Retention reflects daily use. It shows whether users can come back and do the same things again without friction. It shows whether navigation is still clear on the fifth visit, whether flows still make sense when tasks repeat, and whether the site or product feels predictable instead of tiring.
From a business angle, this is where design begins to affect long-term numbers: renewals, repeat purchases, upgrades, and support load. If an interface makes everyday actions slower or more confusing, people quietly leave. If it supports routine work, they remain.
A redesign that only affects first-time behavior works at the surface. A redesign that improves repeated actions changes how the product functions in practice.
User Retention as the Ultimate Measure of Web Design Success
People keep using systems that feel stable.
Retention is usually higher where navigation behaves the same way everywhere, pages follow familiar patterns, and actions lead to expected results. When an interface does not surprise the user, it becomes easier to rely on. Over time, this familiarity matters more than visual style.
Usability details carry most of the weight here. Fewer unnecessary steps, clearer labels, simpler paths to common actions, and understandable error messages shape how a product feels in daily use. These changes do not attract attention, but they strongly affect whether working with the product feels easy or exhausting.
The first signs of retention change usually appear in ordinary data: how often users return, how many functions they actually touch, how quickly they move through onboarding, and how often they contact support. Feedback mirrors this. When the same complaints stop appearing and the same actions become easier to complete, users tend to stay longer.
This is also where design stops being decorative and becomes structural. Decisions about page structure, interface rules, onboarding logic, and content boundaries determine whether the experience holds together as the product grows. Understanding what to control in web design, and what can be safely delegated, often decides whether consistency survives new features and new teams.
In ROI terms, retention shifts attention away from launch effects and toward everyday use. Design pays off here not through spikes, but through fewer drop-offs, steadier behavior, and lower friction over time.
How to Continuously Improve Your Web Design ROI
A website does not keep its effectiveness on its own. Content changes, products evolve, traffic sources shift, and user expectations move. Even a strong design slowly drifts away from how people actually use the site. ROI depends less on big redesigns and more on whether the interface is regularly corrected.
Improvement comes from paying attention to where the site no longer matches real behavior. Pages that once worked stop working. Flows that made sense become overloaded. New features disrupt old logic. Without regular adjustment, design quality degrades quietly.
Iterate Based on Data
Useful iteration starts from observation, not ideas.
Drop-offs in checkout, low interaction on product pages, repeated support questions, weak onboarding completion, or falling demo quality usually point to specific interface problems. These signals tell you where the site stopped helping and started interfering.
When updates are tied to such signals, design changes become practical. Content is reordered because users miss key information. Sections are simplified because people don’t scroll them. Steps are removed because forms stall. Navigation is adjusted because paths break. Each change responds to something visible.
Small corrections applied often are usually more effective than rare, large redesigns. Reworking a single block, simplifying one flow, or clarifying one decision point can affect results without disrupting the whole system. Over time, these adjustments accumulate into measurable improvement.
What matters most is regularity. When review and correction become part of routine work, design stops being something you “redo” and becomes something you maintain.
Cross-Team Collaboration for Long-Term Success
Design does not live in isolation. What appears on a page is shaped by marketing promises, product logic, and technical constraints. When these areas don’t communicate, design problems repeat.
Marketing teams see who arrives, what questions people bring, and where expectations mismatch reality. Product teams see which features are used, which are ignored, and where users fail. Development teams see performance limits, technical debt, and structural risks. All of this affects how the interface actually works.
When design decisions are discussed across these functions, they become grounded. Layouts reflect real user paths. Pages support real product use. Technical choices support stability instead of working against it.
This cooperation is also what keeps ROI from eroding. As new features appear and campaigns change, shared ownership prevents the site from turning into a patchwork. Patterns stay consistent. Old solutions are reused. Proven structures are extended instead of replaced.
For founders and teams, long-term design ROI is rarely about a better redesign. It is about whether the organization keeps the experience coherent as everything else changes.
How to Make ROI Metrics Work for Your Web Design Team
ROI metrics only become useful when they are part of everyday work. If numbers exist only in presentations or monthly reports, they don’t change how pages are designed or how decisions are made. For a design team, metrics matter only when they influence priorities, discussions, and trade-offs.
This starts with being specific from the beginning and continues with keeping design work connected to the same indicators the rest of the business already relies on.
Website Design for Outsourcing SRE Platform by Shakuro
Set Clear, Measurable Goals Upfront
Design work becomes difficult to evaluate when goals are blurred. “Update the site” or “improve UX” cannot be checked against reality. A goal has to describe something that can actually be observed.
Reducing checkout abandonment, increasing demo requests from product pages, improving onboarding completion, raising activation of a feature, or lowering support requests related to navigation are all concrete goals. Each of them points to a particular area of the interface and to actions that can be tracked.
When this is agreed before work starts, design discussions become more grounded. Decisions about layout, structure, and flows are no longer defended by preference. They are discussed in terms of whether they are likely to affect the specific behavior that matters.
Clear goals also prevent cosmetic success. If the aim is better demo quality, more traffic is irrelevant. If the aim is smoother onboarding, homepage engagement is secondary. ROI only stays meaningful when it is tied to a small number of concrete outcomes.
Align Design with Business KPIs Across Departments
ROI becomes much easier to work with when design uses the same reference points as sales, marketing, and product.
Marketing teams see who comes to the site and what expectations they bring. Sales teams see which leads turn into real conversations and where deals break. Product teams see how people actually use features and where they stop. All of this describes the same user path, just from different sides.
When design is separated from these conversations, it usually drifts toward surface improvements. When it is discussed together with business indicators, it stays close to real problems. A pricing page redesign is no longer about layout, but about lost deals. An onboarding update is no longer about visuals, but about people failing to start using the product. A navigation change is no longer about aesthetics, but about repeated support issues.
Shared metrics also make outcomes clearer. If design changes lead to better leads, smoother sales calls, higher feature usage, or fewer recurring support questions, their effect becomes visible without special explanation.
For a web design team, this alignment often determines whether their work is perceived as execution or as contribution. When design metrics reflect business metrics, ROI stops being something that has to be justified afterward and starts shaping what gets built in the first place.
Final Takeaway: ROI = Results, Not Aesthetics
Web design becomes valuable only when it changes outcomes. Not when it looks modern, not when it satisfies internal taste, and not when it inflates surface-level numbers, but when it improves how a business earns, retains, and supports users.
Every serious design decision should connect to something outside the design team: revenue, lead quality, activation, retention, or operational load. When this connection exists, design stops being subjective and starts being accountable.
Design Decisions Should Be Tied to Business Metrics, Period
If a design change cannot be connected to a business metric, it belongs to visual preference, not ROI.
Structure, navigation, performance, and interaction patterns should exist to make something concrete better. They should help users understand faster, choose more confidently, complete tasks with fewer errors, and return without friction. When design works at that level, the effect appears where it matters: in qualified demand, in conversion quality, in lifetime value, and in retention.
Teams that consistently extract return from design are not the ones that redesign most often. They are the ones that observe behavior, measure what design actually affects, and correct what stops working. Over time, this turns web design from a periodic expense into part of the operating core of the business.
If your website or product interface is treated as a business tool rather than a visual layer, the level of expertise behind it matters. Shakuro is an expert in web design for digital products and platforms, helping companies build and evolve interfaces that are tied to real business performance.
If you are looking for expert web design support that focuses on outcomes instead of decoration, Shakuro works with teams to align design decisions with revenue, retention, and long-term product goals.