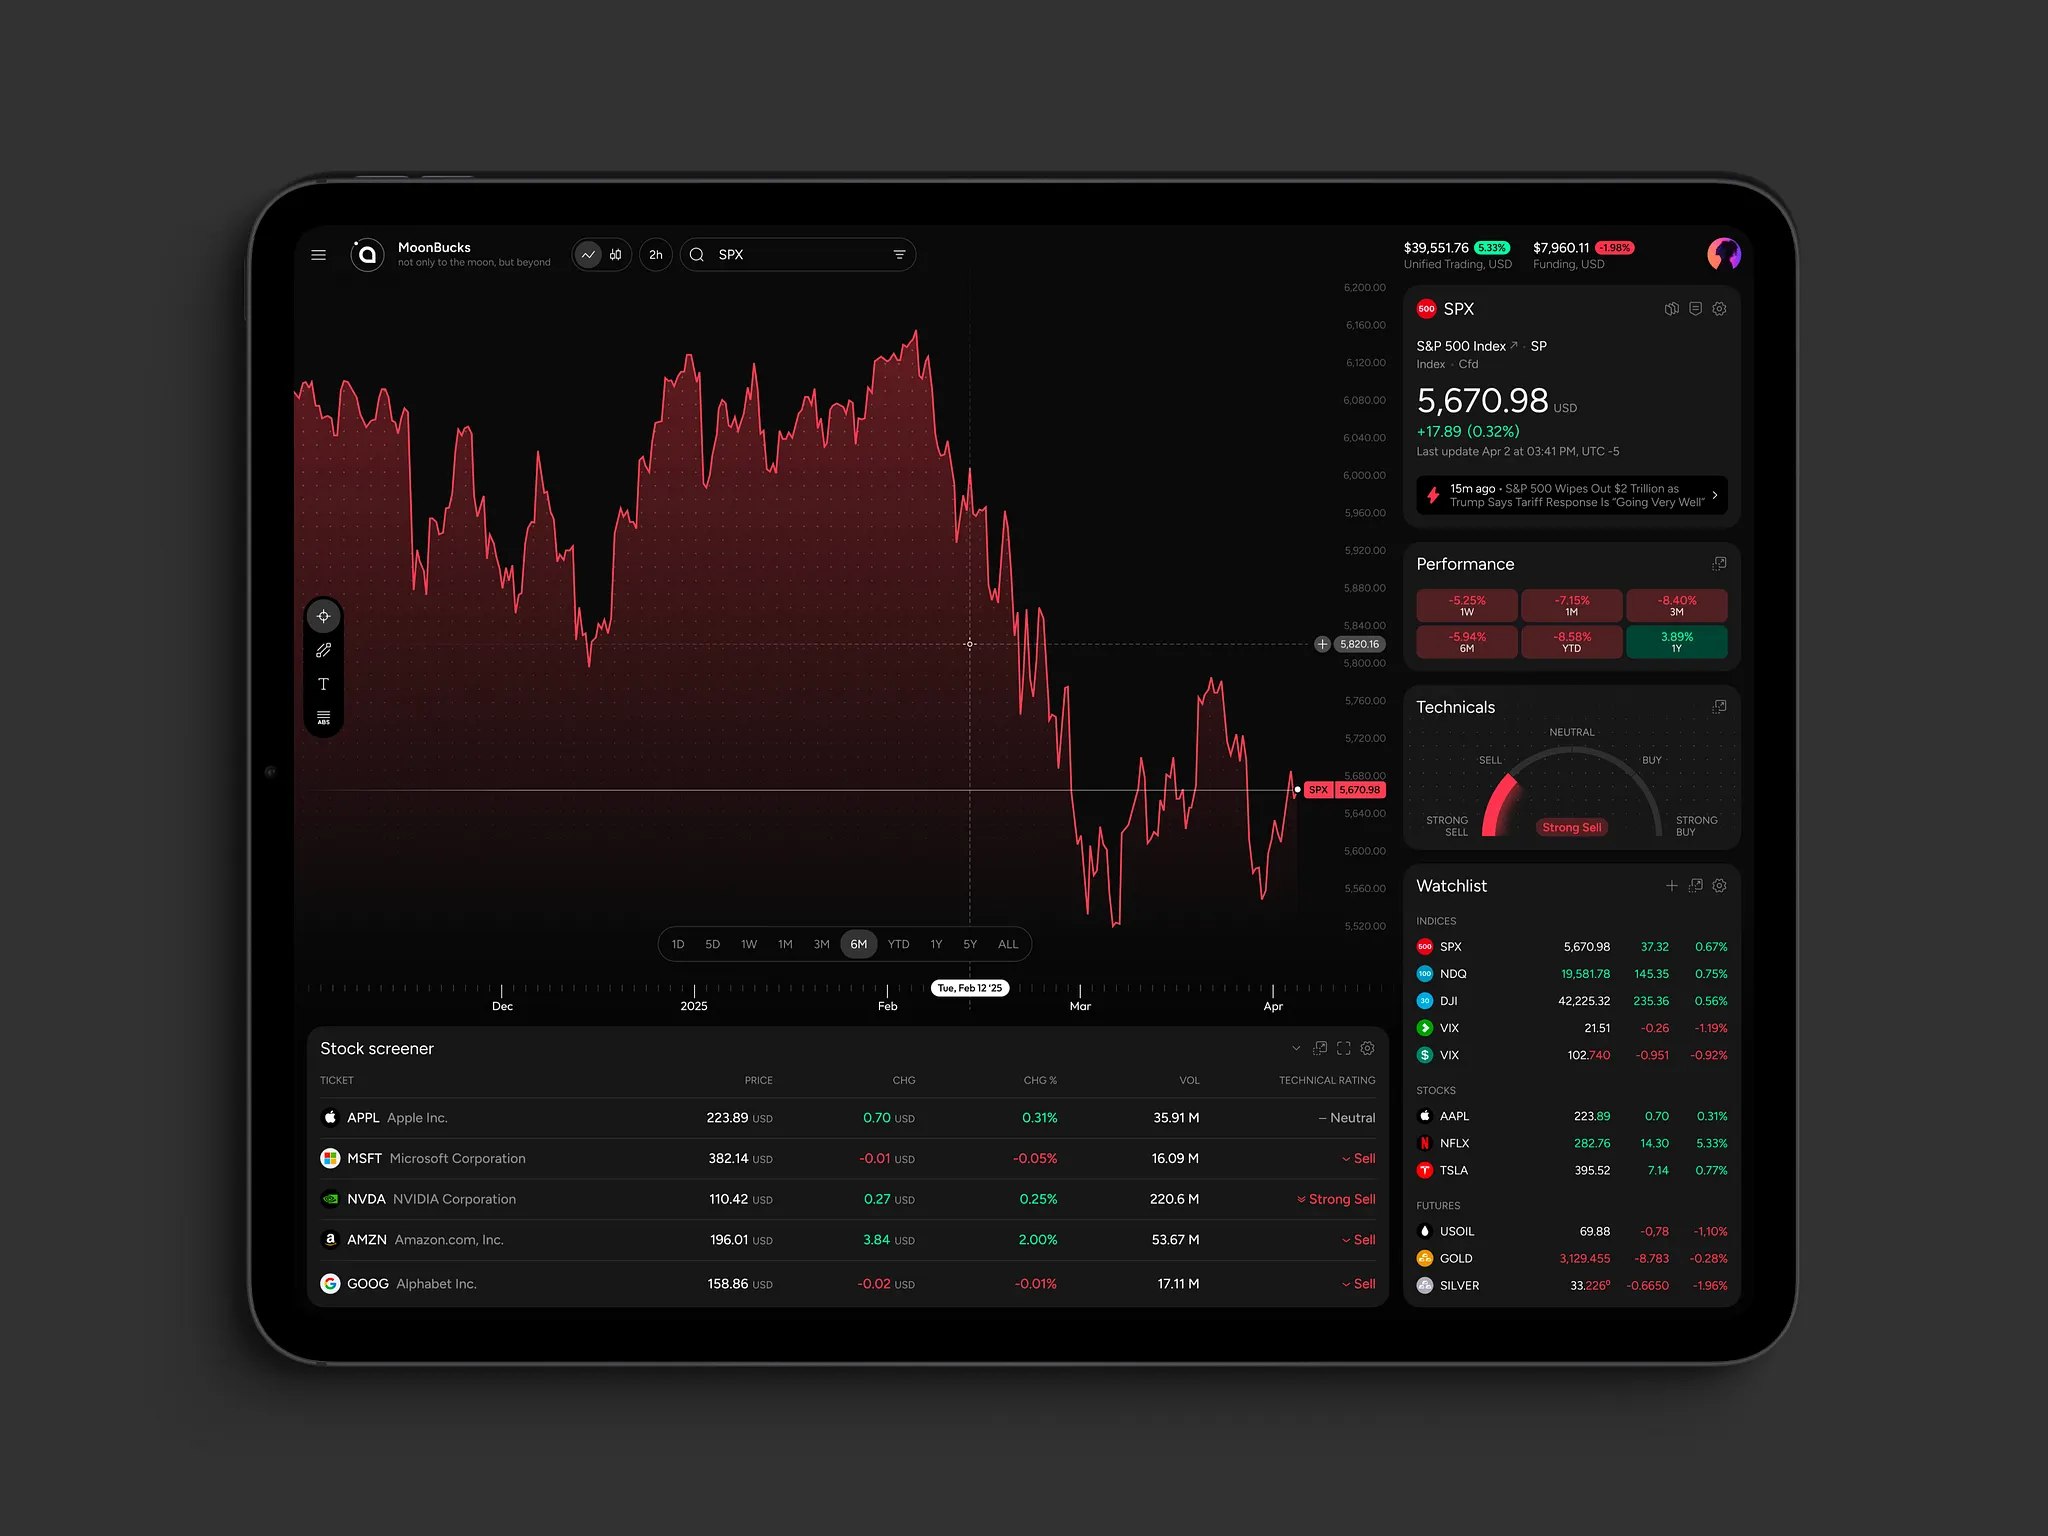
A stock analytics platform is software used to work with market data when trading is not the immediate goal. It exists to analyze, compare, and review information: price history, volumes, financial metrics, corporate events, portfolio results. The focus is not execution, but understanding.
Contents:
This is where it diverges from a trading terminal. A terminal is opened when a decision has already been made. It is about access and speed. An analytics platform is used earlier and later. Earlier—to see how similar situations played out before. Later—to understand what actually happened and why.
In professional setups, the two are rarely interchangeable. Trading tools handle orders. Analytics tools handle reasoning. Mixing those roles usually leads to rushed decisions or shallow analysis.
Markets generate too much data to interpret manually. Without structured analytics, teams rely on fragments: recent charts, isolated trades, short memory. Over time, that leads to inconsistent decisions. Analytics introduces continuity. It forces teams to look at longer periods, repeated outcomes, and measurable risk instead of impressions.
Key Use Cases
Most stock analytics platforms are used for routine analytical work, not for occasional deep research.
- Technical analysis is a common starting point. Historical price data is reviewed to understand trends, volatility, and behavior under different conditions. The goal is not prediction, but familiarity. Knowing how an asset usually behaves reduces surprises.
- Market research comes next. Assets are compared across sectors, timeframes, or market cycles. Analysts look at how prices react to earnings, policy changes, or macro events, and whether those reactions repeat.
- Portfolio tracking shifts attention away from single positions. Exposure, allocation, and performance are viewed across the whole portfolio. This is where hidden risks usually surface—overlapping bets, unintended concentration, slow drift.
- Risk analysis uses the same data to quantify downside. Volatility, correlations, drawdowns, and stress scenarios are measured to understand where losses accumulate. This does not prevent losses, but it makes them predictable.
- After trades are closed, analytics platforms are used for performance review. Results are compared with assumptions. Some strategies hold up, others do not. This review is usually unglamorous, but it is what improves outcomes over time.
These use cases overlap in practice. Platforms are valuable because they support all of them without forcing teams to move data between separate tools.
Who Needs It
Stock analytics platforms are built for teams, not for individual experimentation. Once decisions involve multiple portfolios, strategies, or stakeholders, informal analysis stops working.
- Fintech startups use analytics platforms when analysis is part of the product itself. This applies to investment apps, advisory services, and research-driven platforms that depend on consistent data processing.
- Brokers use analytics to complement execution. Research, reporting, and portfolio insights help retain clients and support higher-value services.
- Investment firms rely on analytics to track performance, control exposure, and explain results internally and externally. Clear data matters when decisions are reviewed by more than one person.
- Proprietary trading firms depend on analytics to evaluate strategies over time. Without historical review, it is impossible to separate skill from randomness.
- Hedge funds usually require deeper analysis: longer datasets, detailed risk metrics, and support for complex, multi-asset strategies.
- There are also specialized analytics products focused on narrow markets or specific analytical approaches, where general-purpose tools are too limiting.
For these organizations, a stock analytics platform is not an enhancement. It is part of daily work—where decisions are checked, assumptions are challenged, and mistakes are identified early.
Why Companies Build Custom Stock Analytics Platforms
Off-the-shelf analytics platforms are convenient at the start. They give quick access to charts, indicators, and basic reporting. For many companies, that is enough—until analytics becomes central to how the business works.
Problems usually appear gradually. Teams hit limits in data access, calculation logic, or workflow flexibility. Simple things turn into workarounds. Exports multiply. Decisions depend on manual checks. At some point, adapting the business to the tool costs more than building a tool that fits the business.
Custom platforms are typically built when analytics is no longer just support, but a source of value, revenue, or control.
Competitive Differentiation
Most market tools offer the same indicators and the same views. Everyone sees roughly the same picture.
Custom platforms allow companies to build their own logic into the system. This might be a proprietary indicator, a specific way of scoring assets, or rules based on internal research. These details often look minor on their own, but together they shape how decisions are made.
Dashboards are another reason. Generic layouts rarely match real workflows. Analysts, traders, and managers consume data differently. With a custom platform, screens are built around actual tasks instead of predefined templates.
Over time, companies add more specialized analytics. Cross-market comparisons, internal metrics, and domain-specific calculations appear naturally as the platform grows. These features are usually too specific for mass-market products.
Data Ownership and Infrastructure Control
Data is often the main reason companies move away from ready-made platforms.
With a custom solution, teams work directly with raw data from multiple providers. There is no guessing how numbers were adjusted or aggregated. Calculations are visible and traceable.
Normalization also matters. Different sources use different formats, timestamps, and conventions. When data is aligned internally, inconsistencies are caught early instead of showing up later in reports or risk metrics.
Infrastructure control adds another layer. Teams know where delays happen, how fresh the data is, and how the system behaves under load. This level of visibility is hard to get when everything sits behind a third-party interface.
Monetization Opportunities
When analytics is part of a product, custom platforms make monetization simpler.
Access can be split by depth of data, historical coverage, or available features. Basic users see one level of detail, advanced users see another.
Paid tiers often include internal indicators or signals that cannot be replicated elsewhere. These features depend on full control over data and calculations.
Some platforms add collaborative elements—shared dashboards, comments, or analyst notes—and include them in higher plans.
In more advanced cases, companies build marketplaces where external analysts or data providers offer signals or datasets through the platform.
All of these models rely on tight control over data, logic, and access. That is usually the point where off-the-shelf tools stop being practical and custom development becomes the obvious choice.
Real-Time Predictive Analytics Dashboard Design by Shakuro
Core Features of a Modern Stock Analytics Platform
There is nothing exotic about the feature set of a modern stock analytics platform. Most of what matters has existed for years. What separates a usable product from a frustrating one is how these things are put together and how stable they are in daily work.
People do not come to analytics platforms to be surprised. They come to get answers without fighting the interface or doubting the data.
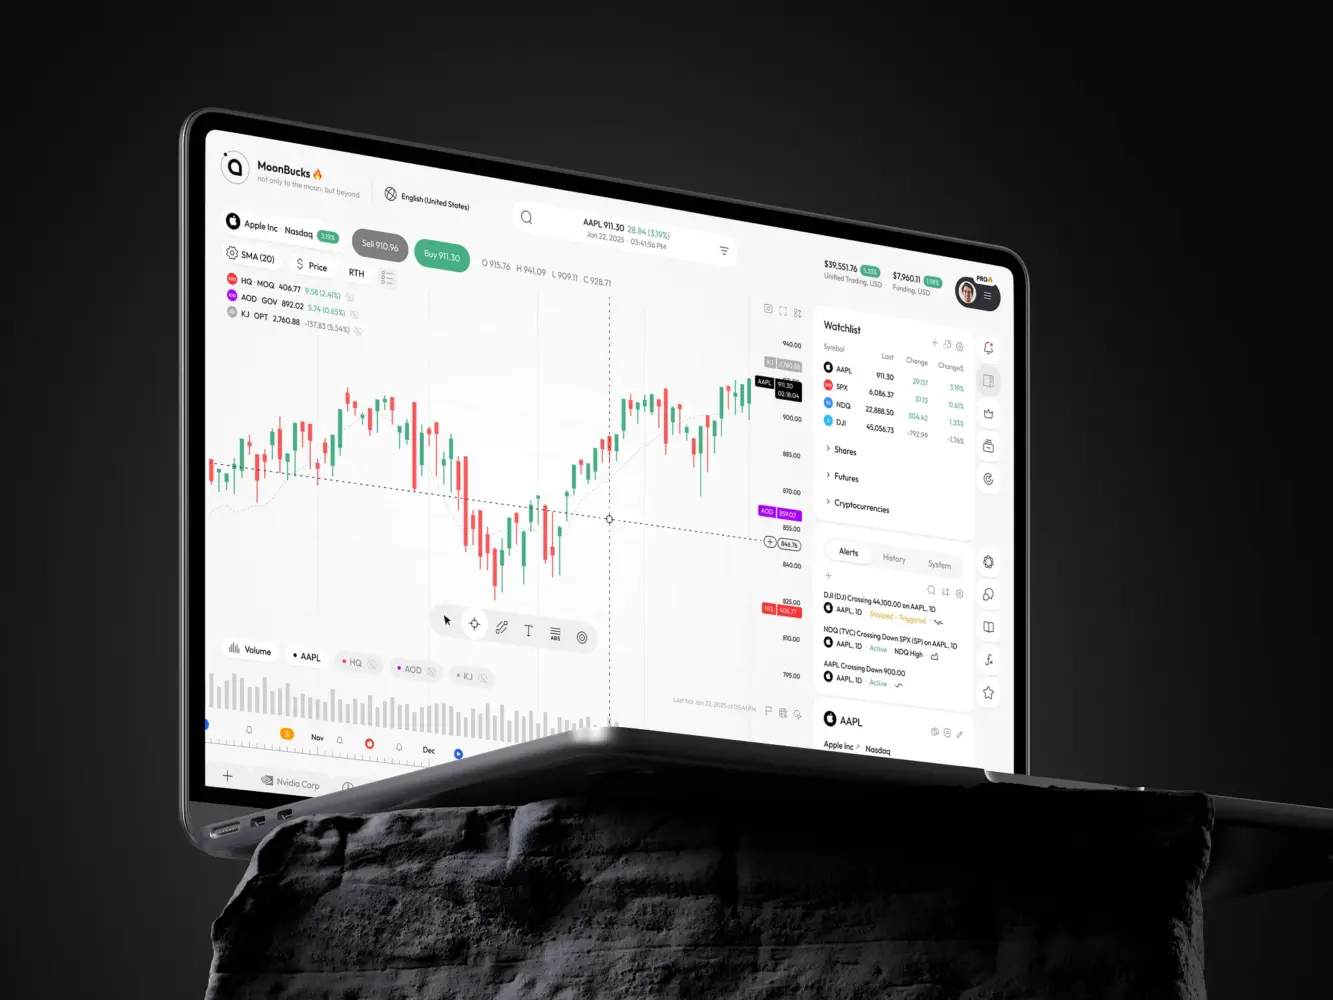
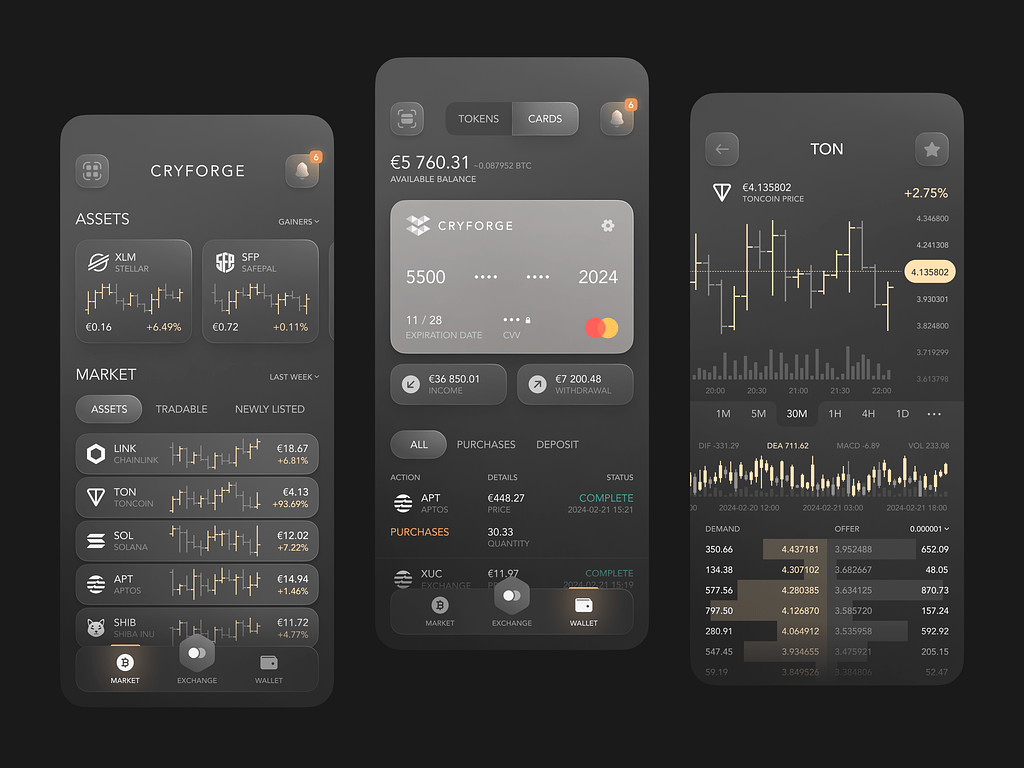
Real-Time Charting and Technical Analysis Tools
Charts are the starting point for almost everyone.
Candlesticks are the default. Other chart types are expected, but rarely used as often. Indicators, overlays, and drawing tools are not “advanced” features—they are basic requirements. Users draw levels, trends, zones, make notes, and adjust parameters constantly.
What usually breaks trust is performance. If charts lag, freeze, or reload unexpectedly, users notice immediately. It does not matter how many indicators are available if switching symbols feels slow.
Multi-Timeframe Dashboards
Looking at one timeframe in isolation is rarely useful.
Most platforms allow users to switch between short-term and long-term views without resetting everything. Tick data, intraday charts, daily and monthly views are all part of the same analysis, not separate modes.
Side-by-side charts are common. People compare assets, periods, or setups visually. Some platforms add correlation tables or matrices to show how instruments move together. These are mostly used when working with portfolios rather than individual trades.
The important part is continuity. Users should not feel like they are starting from scratch when changing perspective.
Data-as-a-Service (DaaS) Integrations
Everything depends on data, even if most users never see that layer.
Analytics platforms pull data from multiple sources. Prices, volumes, corporate actions—all of it has to be ingested, cleaned, and aligned. Different providers use different formats and timestamps, and these differences cause problems if they are not handled carefully.
When data handling is sloppy, errors show up later in charts, reports, or risk metrics. That is usually when users lose confidence. Platforms that are strict about data quality tend to be trusted more, even if the interface looks simpler.
Portfolio and Risk Analytics
As soon as trades accumulate, looking at them one by one stops making sense.
Portfolio views show positions together: exposure, allocation, and performance over time. Basic PnL is expected. More useful views break results down by asset, strategy, or period.
Risk metrics sit on top of this. Volatility, drawdowns, win rates, concentration—these numbers are not checked every minute, but they influence decisions quietly. They show where returns come from and how fragile they are.
These features are rarely flashy, but they keep people using the platform long-term.
Alerts, Signals, and Automated Insights
Alerts are usually the first thing users configure.
Simple alerts are price-based or indicator-based. More advanced setups allow combinations of conditions. This saves time and reduces the need to watch charts constantly.
Some platforms offer automated signals generated by models. These only work when users understand what they are based on. Black-box signals tend to be ignored, especially by experienced traders.
Automation is useful when it points attention in the right direction, not when it tries to make decisions instead of the user.
Social Trading and Community Features
Some analytics platforms add a social layer.
This usually means feeds, comments, or shared ideas linked directly to charts or instruments. Users follow other traders or analysts and see their public thoughts over time.
Examples include platforms like Symbolik or Tinkoff Pulse, where discussion is tied to actual market data, not detached posts.
These features are hard to balance. Without moderation, they turn into noise. When done carefully, they add context rather than distraction.
Web and Mobile Platform Support
Most serious analysis still happens on desktop.
Mobile apps are usually used for monitoring: checking positions, reviewing alerts, looking at saved charts. Users do not expect full analytical depth on a phone, but they do expect consistency.
If alerts behave differently on mobile, or saved views do not sync, trust drops quickly. Good platforms treat web and mobile as one system, not separate products that drift over time.
Case Studies: Our Experience Building Niche Stock Analytics Platforms
Most analytics platforms look similar on the surface. The difference usually appears once you understand who the product is built for and what problems it deliberately chooses to solve. Our work with niche analytics platforms follows that logic: narrow audience, clear use cases, and no attempt to be everything for everyone.
One of the clearest examples of this approach is Symbolik.
Symbolik — Advanced Technical Analysis & Social Trading Platform
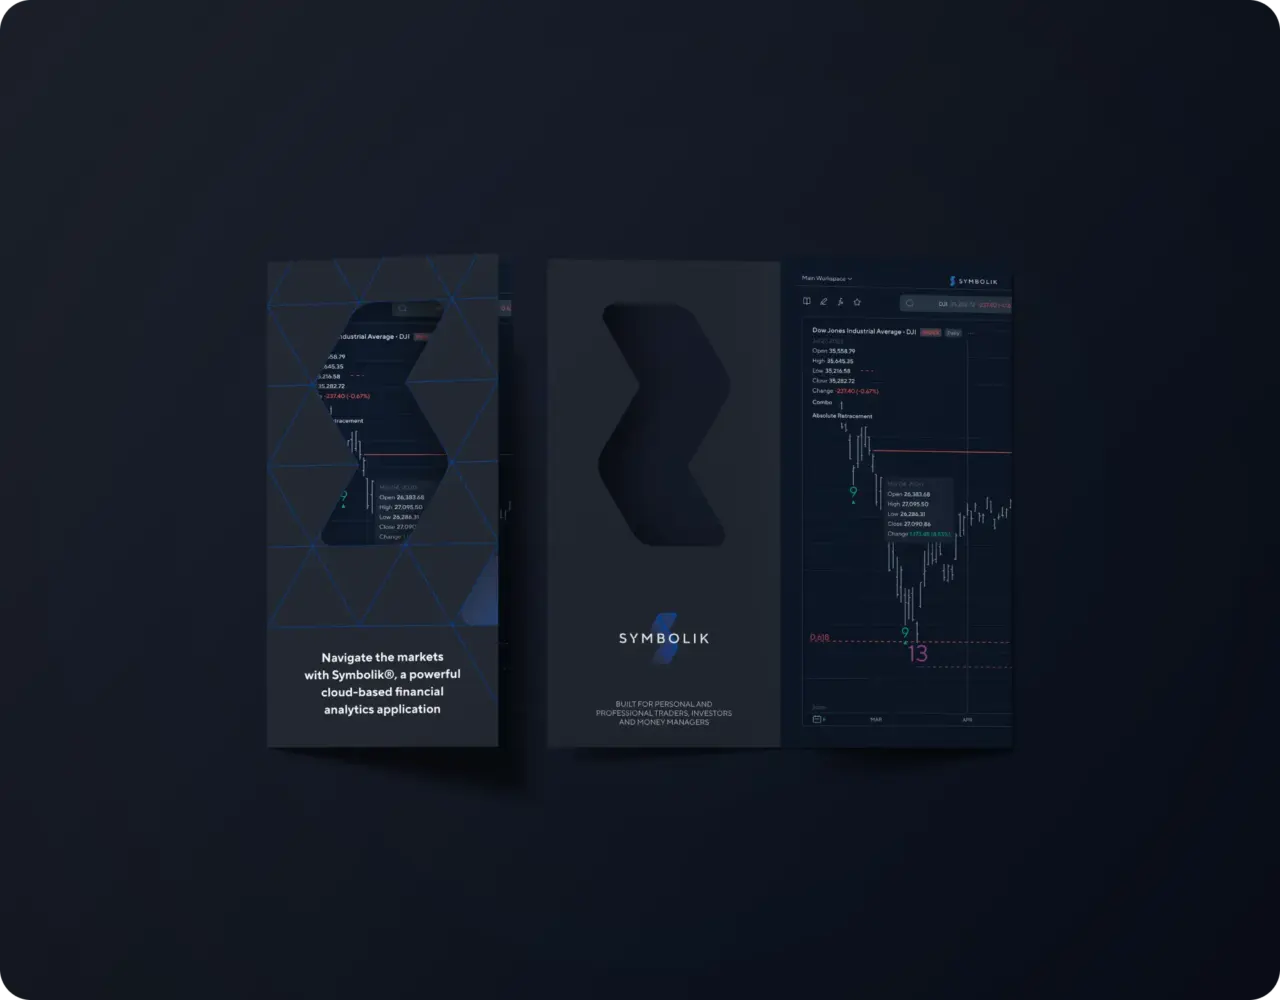
Symbolik UX/UI design by Shakuro
Symbolik is not a retail trading app and not a generic analytics dashboard. It is an institutional-grade technical analysis platform built around professional workflows and a very specific audience: money managers, professional traders, and analysts.
At its core, Symbolik started as a standalone charting and analytics product with deep roots in technical analysis. The platform is closely associated with Tom DeMark and his indicators, which have been used by institutional traders for decades. That background set the bar for both analytical depth and precision from the beginning.
Deep Technical Analysis as the Foundation
Technical analysis in Symbolik is not an add-on. It is the foundation.
The platform supports advanced charting with a strong focus on clarity and control. Users can customize charts extensively, apply multiple indicators, compare assets in real time, and work with complex setups without losing context. This is not designed for casual browsing; it is built for people who spend hours inside charts and expect tools to keep up.
Custom indicators play a major role. Symbolik allows users to work with proprietary studies alongside standard technical tools, which is critical for professionals who rely on specific methodologies rather than default indicators.
Multi-Layered Dashboards for Professional Workflows
Symbolik’s dashboards are built around how analysts actually work, not around generic layouts.
Users can combine multiple charts, instruments, and analytical views into a single workspace. Switching between assets or timeframes does not reset the analysis. This makes it possible to move from high-level market context to detailed setups without breaking concentration.
The goal was not to simplify analysis, but to remove friction. Professional users already know what they are looking for. The platform’s job is to make that process faster and more reliable.
Real-Time Data and DaaS Integration
Real-time market data is treated as a core dependency, not a feature.
Symbolik integrates live data streams directly into charts, watchlists, and analytical tools. Data handling is explicit and consistent, which is especially important when users rely on small timing differences or precise indicator behavior.
This approach avoids the typical “black box” problem, where users see numbers but cannot tell how or when they were produced. For a professional audience, that transparency matters more than visual polish.
Social Layer Built for Analysts, Not Engagement Metrics
One of the most distinctive parts of Symbolik is its social layer.
Symbolik Social was created as a response to how professional traders were already communicating—through private chats, informal groups, and external messengers. The idea was not to recreate a general-purpose social network, but to bring discussion directly into the analytical environment.
The social features include posts, comments, groups, direct messaging, and shared ideas—all tightly connected to charts, instruments, and technical studies. Discussions are anchored in actual market data, not detached opinions. In this sense, the experience is closer to a professional knowledge exchange than to mainstream social feeds, with parallels to products like Tinkoff Pulse, but adapted for an institutional audience.
Importantly, the platform avoids attention-driven mechanics. There is no emphasis on emojis, viral formats, or artificial engagement. The focus is on readability, structure, and signal quality.
Clear Niche and Defined Audience
Symbolik does not try to appeal to beginners or casual investors. That choice is intentional.
The platform is built for users who already understand markets and technical analysis and want better tools and a better environment to work in. This clarity influenced every design and development decision—from information architecture to feature prioritization.
As a result, Symbolik stands out not by adding more features than competitors, but by serving its niche consistently and without compromise.
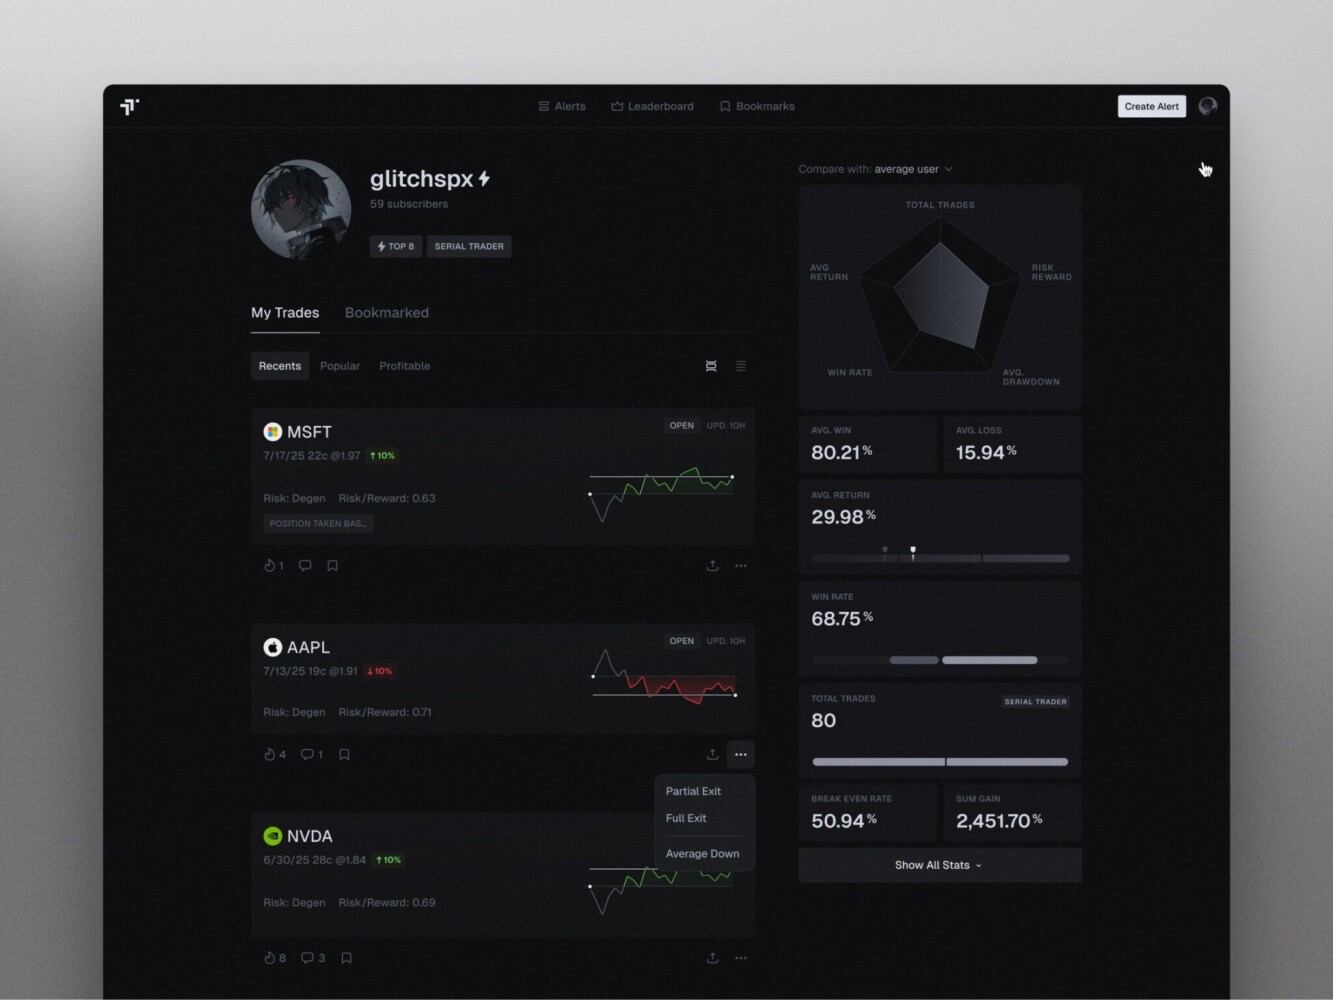
TraderSync-Style Analytics Engine—Trade Journaling and Performance Review
We’ve worked on several analytics engines built around trader journals. These systems are not about finding trades. They are about reviewing what already happened.
Everything starts with trade logging. Each trade is recorded with exact parameters: instrument, size, entry, exit, timing. No summaries. No rounding. If the data is wrong here, nothing else matters.
Performance analysis is built on top of that history. Not just total profit, but results split by strategy, timeframe, asset, and market conditions. This is usually where traders realize that a small part of their activity generates most of the outcome.
Pattern detection is based on repetition. The system highlights recurring behavior: late entries, early exits, increased risk after losses, overtrading in specific sessions. These patterns come from numbers, not comments.
Behavioral metrics sit alongside financial ones. Holding time, consistency, win/loss distribution, reaction to drawdowns. These metrics are not meant to look good. They are meant to be accurate.
Dashboards are built for review, not presentation. Fast loading. No animations. Clear filters. The goal is to let a trader answer questions quickly and move on.
If reviewing trades takes too long, people stop doing it. That’s the main constraint in systems like this.
TraderTale—Investment Analytics at Portfolio Level
TraderTale: Social Platform for Traders by Shakuro
TraderTale is built around the idea that trading history should be visible and structured, not buried in exports.
Our work focused on portfolio-level analytics. Trades are not shown in isolation. They are grouped into timelines, summaries, and comparisons that show how someone trades over time.
Market data is tightly integrated. Trades and alerts are always shown with price context. Historical data is processed once and reused everywhere to avoid mismatches between views.
Charts are used differently than in trading terminals. They explain outcomes rather than guide entries. Most charts are reviewed after the fact, not during live trading.
Risk and volatility metrics are central. Returns alone are not enough. Drawdowns, exposure, and stability affect how performance is interpreted and ranked.
Data processing is strict. Inputs are cleaned, normalized, and validated before analytics are calculated. This keeps profiles, leaderboards, alerts, and dashboards consistent with each other.
The platform is designed for desktop and mobile from the same data layer. Desktop is used for analysis. Mobile is used for alerts and quick checks. The logic does not change between devices.
The result is a system where trading performance turns into something measurable and comparable, without hiding weak spots behind visuals.
How to Build a Stock Analytics Platform
A stock analytics platform usually fails long before launch. Not because of bugs, but because the wrong things were decided too late. Most of the work is not technical in the narrow sense. It is about constraints, habits, and data that never stops coming.
Step 1—Product Discovery and Requirements
First, decide who the user is. One group.
If the platform is for professional traders, build for that. If it’s for long-term investors, build differently. Trying to cover everyone turns into endless exceptions.
Write down what the user actually does. Not features. Actions. What they open first. What they check daily. What they ignore.
Compliance questions go here. Data retention, reporting, identity checks. Even if the first version doesn’t need them, the system should not block them later.
At this stage, also decide what you are not building. That matters just as much.
Step 2—Architecture and Data Pipeline Design
Market data never stops. That shapes everything.
Data ingestion has to be separate from processing. Processing has to be separate from delivery. Otherwise, one slow part brings everything down.
Queues smooth out spikes. Caches prevent recalculating the same thing repeatedly. Storage rules are defined early and not changed lightly.
Be honest about latency. Some data needs to be instant. Some doesn’t. Treating everything as real-time usually causes more problems than it solves.
Step 3—UI/UX Design for Traders
This is not presentation design.
Analytics interfaces are dense. Users look at numbers and charts for long stretches of time. If something is hard to read or slow to react, it gets noticed immediately.
Animations and effects don’t help here. Clear structure does. Predictable behavior does.
Keyboard shortcuts, saved layouts, consistent controls—these things matter more than visual flair.
If the interface feels tiring, people stop using it.
Step 4 — Back-End and Front-End Development
Back-end logic is mostly about correctness.
Analytics calculations need to be repeatable. Same input, same result. No surprises.
APIs should give the front end exactly what it needs, not raw data that has to be reshaped on every request.
Charting logic is usually isolated because it has different performance requirements. Long histories and frequent updates expose weak spots quickly.
Live updates are useful, but only in specific places. Pushing everything in real time usually creates noise.
On the front end, the main job is to stay responsive while data keeps changing.
Step 5—Integrations (Market Data, Brokers, Payments)
Integrations are never as simple as they look.
Market data feeds differ in formats, timing, and reliability. Each one needs validation and fallback handling.
Broker connections behave differently under load than in demos. Order states, partial fills, and errors need to be handled carefully.
Payments and KYC affect onboarding, storage, and support. They are not “later problems.”
Step 6—Testing and Performance Optimization
Test the platform the way it will be used.
Load it with real amounts of data. Open multiple charts. Switch timeframes fast. Break feeds on purpose.
Performance issues usually come from data aggregation and state handling, not from obvious bottlenecks.
Stability matters more than raw speed. Users prefer something slightly slower that behaves the same every time.
Step 7—Deployment and Continuous Support
Assume the platform will keep changing.
Monitoring should be in place from the start. Logs should explain failures without guesswork.
Releases are incremental. Big launches rarely survive first contact with real users.
Support doesn’t end. Markets change. Data providers change. User behavior changes. The system has to adjust without being rebuilt from scratch.
Crypto Mobile App Concept by Shakuro
Technology Stack for Stock Analytics Platforms
Stack discussions around analytics platforms often sound more confident than they really are. In practice, most choices are made under pressure: data volume grows, latency becomes visible, something starts to break.
What matters is not picking “the best” stack, but picking something the team can actually run and debug.
Backend Technologies
There’s no shortage of backend options here. Most platforms end up mixing several.
Python shows up almost everywhere. It’s used for data processing, analytics logic, and anything that changes often. Easy to write, easy to adjust. Performance is handled elsewhere.
Go is usually picked for services that can’t afford surprises. Ingestion, streaming, internal services that sit under load all day. It’s boring in a good way.
Java still runs a lot of long-lived systems. Especially where stability matters more than iteration speed.
Node.js often sits at the edges. APIs, real-time endpoints, anything tied closely to the frontend.
Most platforms end up with microservices, not because they planned to, but because ingestion, analytics, auth, notifications, and reporting don’t scale the same way. Keeping them together becomes painful fast.
Frontend and Charting Libraries
On the frontend, teams usually settle on something familiar.
React is common. So is Vue. The choice matters less than how state is handled once charts, filters, and live updates collide.
Charting is where things get expensive.
Simple libraries work until datasets grow. Then WebGL-based charts become necessary. They handle large time series better, but they’re harder to control.
D3.js is often used when nothing off-the-shelf fits. Powerful, but easy to misuse. Performance problems here are usually self-inflicted.
Most teams end up mixing charting approaches. Heavy charts where needed. Lightweight ones everywhere else.
Databases and Data Storage
No single database survives contact with real analytics workloads.
ClickHouse is often brought in once query volumes grow. It’s fast for analytics, but not forgiving if schemas or queries are sloppy.
TimescaleDB and PostgreSQL usually sit underneath everything. User data, configs, metadata, smaller time-series. PostgreSQL often ends up as the anchor whether planned or not.
Redis shows up as soon as something needs to be fast. Caching, sessions, short-lived calculations. Without it, the system feels sluggish.
Trying to force all data into one store usually fails. Most teams accept that early or learn it later.
DevOps and Cloud Infrastructure
Infrastructure grows up as the platform does.
Docker is standard. It simplifies local work and deployments enough that there’s no reason not to use it.
Kubernetes appears once services multiply. Not because it’s elegant, but because manual scaling stops working.
Cloud providers like AWS and Google Cloud are typical choices. Autoscaling helps, but only if services are built with limits in mind.
CI/CD becomes unavoidable. Analytics platforms change constantly. Data sources shift. Metrics evolve. Manual deployments don’t survive long.
The biggest problems here are rarely tooling gaps. They’re visibility gaps. Without proper logs, metrics, and alerts, failures get noticed too late and diagnosed too slowly.
Cost of Building a Stock Analytics Platform
People usually ask for a number. That’s the wrong place to start. The cost of a stock analytics platform is mostly defined by how much data it touches and how often it changes. Everything else is secondary.
Most teams underestimate cost not because they forget features, but because they underestimate how much time is spent fixing, tuning, and revisiting things that already exist.
Factors Affecting Cost
Analytics depth is the first variable that moves the budget.
Simple charts and a handful of indicators are quick to put together. The moment you want portfolio-level views, multiple timeframes, pattern detection, or behavior-based metrics, the work multiplies. Not because it’s exotic, but because all of those pieces depend on the same data and need to stay consistent.
Integrations add ongoing cost. Market data feeds, broker APIs, payments, identity checks — none of them are “set and forget.” They break, change formats, or behave differently under load. Every integration becomes a small system of its own.
Charting is another area that surprises people. Basic chart libraries are cheap. High-performance charts that handle long histories, overlays, and live updates take time to tune. Most of that work happens after the first version is already “done.”
Mobile support raises costs even if it looks simple. Supporting mobile properly means extra design decisions, testing, and maintenance. A stripped-down app still needs to be kept in sync with the main product.
MVP vs Full Product
An MVP in analytics is not as small as it sounds.
Even a minimal version usually needs real charting, real data, user accounts, and some form of analytics. You still need ingestion, storage, and basic infrastructure. Skipping these parts usually leads to rewrites.
In practice, MVP timelines are measured in months, not weeks. Most of the time goes into backend logic and data handling, not UI.
A full product grows in pieces. New analytics, more data sources, better performance, mobile features, reporting. Each addition is manageable on its own. Together, they define the real cost of the platform.
Maintenance and Scaling Costs
This is where budgets are often wrong.
Market data is a recurring expense. As usage grows, so do licensing fees and bandwidth costs. Changing providers later is possible, but it takes effort.
Infrastructure costs rise with activity. More users, more charts open at once, more live updates. Even well-optimized systems have a baseline cost.
Development doesn’t stop after launch. Users ask for changes. Markets change. Data sources change. Keeping the platform useful requires steady work.
Maintenance includes things people don’t always count: monitoring, performance tuning, fixing broken feeds, cleaning data. Ignoring this work doesn’t save money—it just pushes problems into production.
Fintech Mobile App UI Design by Shakuro
Challenges in Building Trading & Analytics Platforms
Most challenges in trading and analytics platforms are not new or mysterious. They’re well known. The problem is that they tend to appear all at once, usually after the product is already in use.
Real-Time Data Processing
Market data does not arrive politely.
It comes in bursts. Different feeds update at different speeds. Some messages arrive late. Some arrive twice. Some don’t arrive at all. The system has to deal with this continuously without freezing dashboards or producing incorrect results.
Low latency matters, but consistency matters more. Users quickly notice when charts jump, values flicker, or numbers don’t line up between views. These issues often come from data being processed in different paths or at different times.
Real-time systems need clear boundaries. Not everything should be processed instantly. Some data can be buffered, aggregated, or delayed slightly without affecting usability. The challenge is deciding where that line is and sticking to it.
Security and Compliance
Security is rarely the part teams want to work on, but it’s the part that causes the most damage when ignored.
Trading and analytics platforms handle sensitive data: portfolios, positions, transaction history, personal details. APIs need to be locked down properly. Permissions need to be explicit. One loose endpoint is enough to cause serious problems.
Compliance adds another layer. Depending on region and product scope, this may include data retention rules, audit requirements, or identity verification. These constraints affect architecture, logging, and storage. Treating them as an afterthought usually leads to expensive refactoring.
Security work is mostly invisible when done right. When done wrong, it becomes very visible very fast.
Performance and Scalability
Performance issues rarely show up in isolation.
A single chart might work fine. Ten charts updating at once expose problems. Add filters, comparisons, and live data, and weak points surface quickly.
Rendering complex dashboards stresses both the frontend and backend. Large datasets need to be sliced carefully. Parallel processing helps, but it has to be controlled. Unchecked parallelism often makes things worse, not better.
Caching is essential, but it’s easy to misuse. Cache too little, and the system feels slow. Cache too much, and users see stale or inconsistent data. Finding the right balance usually takes multiple iterations in production.
Scalability is not just about handling more users. It’s about handling the same users doing more things at the same time. That’s where most platforms struggle.
Why Work With a Specialized Fintech Development Team
Building a trading or analytics platform is not just software work. It sits at the intersection of data engineering, performance optimization, and financial logic. Teams without prior exposure usually underestimate how tightly these things are connected.
A specialized fintech team does not remove complexity, but it reduces the number of wrong turns.
Domain Expertise
Teams that have already built trading or analytics systems recognize the problems early.
They understand how market data behaves in real conditions, not just in documentation. They know where data pipelines usually break, how charting engines behave under load, and why certain technical analysis features cause performance issues if implemented naïvely.
Experience with analytics-heavy products also matters for things beyond charts. Social features, alerts, and collaboration tools behave differently when tied to live market data. Without prior exposure, teams often bolt these parts on and deal with the consequences later.
Domain knowledge does not guarantee perfect decisions, but it shortens the feedback loop significantly.
Proven Development Process
A working process matters more than individual tools.
Specialized teams tend to follow a delivery structure shaped by previous failures. Discovery is tighter. Scope is questioned early. Assumptions about data, performance, and compliance are surfaced before development starts.
This leads to more predictable delivery. Fewer surprises mid-project. Fewer “we’ll fix it later” decisions that turn into rewrites.
Clear communication is part of this. When a team knows the domain, discussions are shorter and more concrete. Fewer explanations are needed. Risks are named early instead of discovered late.
Faster Time to Market
Speed does not come from working harder. It comes from not reinventing things that are already understood.
Specialized fintech teams usually rely on reusable components: data ingestion patterns, charting foundations, analytics modules, authentication flows. These are not copy-pasted solutions, but tested starting points.
Established workflows also help. Decisions around architecture, data handling, and performance are made faster because the trade-offs are familiar.
The result is not rushed delivery. It is fewer detours. The product reaches a usable state sooner and evolves through iteration instead of rework.
Conclusion
Building a stock analytics platform is not a single project with a clear finish line. It’s a system that grows alongside its users, its data, and the markets it tracks. The difference between platforms that survive and those that don’t is rarely vision. It’s execution and follow-through.
Summary of Key Steps
The work usually starts with narrowing the scope. Defining who the platform is for and what problems it actually solves. Without that, everything else drifts.
From there, architecture and data pipelines are set up to handle continuous market data without locking the product into fragile decisions. UI and UX design focuses on clarity and speed rather than visual novelty. Development balances correctness and performance, with real-time features added where they truly matter.
Integrations, testing, deployment, and ongoing support are not separate phases. They overlap and repeat. Platforms improve through iteration, not one-time releases.
Most of the effort goes into details users never see — data quality, performance tuning, stability—and that is usually where success is decided.
Build Your Platform with Shakuro
At Shakuro, we work with trading and analytics platforms as long-term systems, not short-term builds. We’ve designed and developed products where data, performance, and user behavior are tightly connected, and where mistakes are expensive.
If you’re planning to build a stock analytics platform—or rethink an existing one—we can help you shape it realistically. From early discovery and architecture decisions to design, development, and scaling.
No templates. No generic promises. Just a clear discussion of what you want to build, what it will take, and how to move forward without unnecessary detours.