For those who prefer to listen rather than read, this article is also available as a podcast on Spotify.
Contents:
Building financial software often feels like trying to climb Mount Everest in flip-flops. One moment you’re sketching out your MVP on a napkin (yes, cliché but true), and the next, you’re drowning in tech jargon, debating whether React or Angular (you know little about each) is better, or wondering if blockchain should be part of your stack. Sound familiar?
Financial is way more complicated than just coding or planning. You have compliance rules breathing down your neck, user expectations through the roof, and let’s not forget scalability because hey, we all want our startups to grow, don’t we? And one more point—you need developers who understand code and also get finance. Trust me, explaining what AML means to someone unfamiliar with fintech is a little annoying, but you’ll get used to it over time.
There are ways to simplify the process, avoid common pitfalls, and actually enjoy building your financial product. Yes, really! If you think about it, having the right approach—and the right partner—can make all the difference.
Stick around, because, in this article, I’m going to break down exactly what you need to look for in financial software development services and share tips on avoiding costly mistakes. Trust me, by the end of this, you’ll feel a lot clearer about your next steps. So grab a coffee (or tea, no judgment here), and let’s dive in!
🔑 Key Takeaways
-
Many financial companies struggle with outdated systems, security risks, and poor user experience — custom financial software development services solve these problems.
-
A trusted financial software development company helps ensure compliance with ever-changing regulations and avoids costly legal issues.
-
Custom fintech software development enables faster transactions, smarter analytics, and seamless mobile experiences.
-
Legacy banking systems often block growth — banking software development services modernize infrastructure without disrupting operations.
-
With the right team, your financial software application development can go from idea to MVP in months, not years.
-
Choosing the right vendor for custom banking software development reduces project risks, delays, and technical debt.
Why Choose Us for Financial Software Development?
By the way, speaking of partners… What if I told you there are companies out there whose entire job is to take the headache out of development processes? They handle everything—from understanding regulatory requirements to making sure your app works seamlessly across devices. Sounds pretty great, huh?
Well, Shakuro is that company. We have time-proven experience in developing fintech apps for personal finance management, banking, analytics, SaaS, trading, etc. While the industry sticks to traditional, often old-fashioned, and unfriendly approaches, our team strives to bring a fresh perspective to operations. We build custom tools like Figma to JSON Exporter to automate routine tasks instead of doing them manually and wasting precious time.
I bet you are familiar with those bank apps where you can wander for hours searching for one sacred button. And it’s often buried under numerous tables, figures, and whatnot. As a financial software development company, we solve problems on a deeper level with UX and accessibility. Those enormous tables are transformed into simplified and glanceable tools, where a user can grasp information in mere seconds. Thus both professionals and newbies make quick and informed financial decisions.
The same goes for cultural differences and legal compliance. Most banking apps aim at the global market, and you have to deal with a diversity of regulations. Let’s be honest, practically no one wants to rack their brain over this, and that’s why we take this burden off your shoulders. For example, our team once collaborated on a Shariah-compliant fintech app, where we had to calculate the Zakat amount because of Islamic religious values. We came up with an automatic feature that simplified the users’ lives.
The compliance leads to another problem: security. Finances are connected with sensitive information. If you don’t protect it, your company’s reputation is at stake. That’s why we implement industry-standard security practices and scalable solutions.
Our Financial Software Development Services
Well, what exactly do we develop in the financial sphere? As I said, our expertise stretches from digital wallets to enterprise products, but apart from seeking and using convenient off-shelf solutions, we offer customized solutions. I’ll dwell on each branch in detail.
Custom Banking Software Development
Banking today isn’t what it used to be. Gone are the days when customers were okay waiting in line for 20 minutes just to deposit a check. Now they want everything at their fingertips—transfers, loans, account management, investment tools—all accessible via their phones while sitting on the couch binge-watching Netflix. And honestly? Who can blame them? Convenience is king these days. But delivering that convenience? That’s where things get tricky.
But when done right, custom banking software development can transform the way your institution operates. The key to success lies in two things: understanding your unique needs and having a partner who knows the ins and outs of both finance and technology. Off-the-shelf solutions might seem tempting at first glance, but they rarely fit perfectly. They’re like buying shoes one size too small; sure, you can squish your feet in there, but eventually, it’s going to hurt. Custom software, on the other hand, is tailored specifically to your goals, workflows, and challenges.
And that’s what we deliver. When comparing solutions to shoes, I meant scalability. You want your platform to grow. Pre-made solutions aren’t always designed to scale gracefully. They might work fine when you’re small, but as soon as traffic spikes or you add new features, they start creaking under the pressure. We build custom financial services software with growth in mind. Our experts are keen on building online banking, loan management, and payment processing systems that can easily scale with time.
Now, cookie-cutter solutions do not pair well with old-fashioned banking systems. Nor do they go hand in hand with third-party APIs. So when you need to integrate something into your app, it is a challenge. In this case, the custom approach is more flexible: you can build what you need brick by brick, like a Lego. Same for legal compliance, the team just bakes necessary options into the app foundation without having to duct-tape fixes onto an existing system later.
During custom financial software development, we work closely with you to strike a balance between ambition and practicality. Using a combination of responsive UX and demanded features, we help you overcome common challenges, save costs in the long run, and ultimately deliver better outcomes for both your business and your customers.
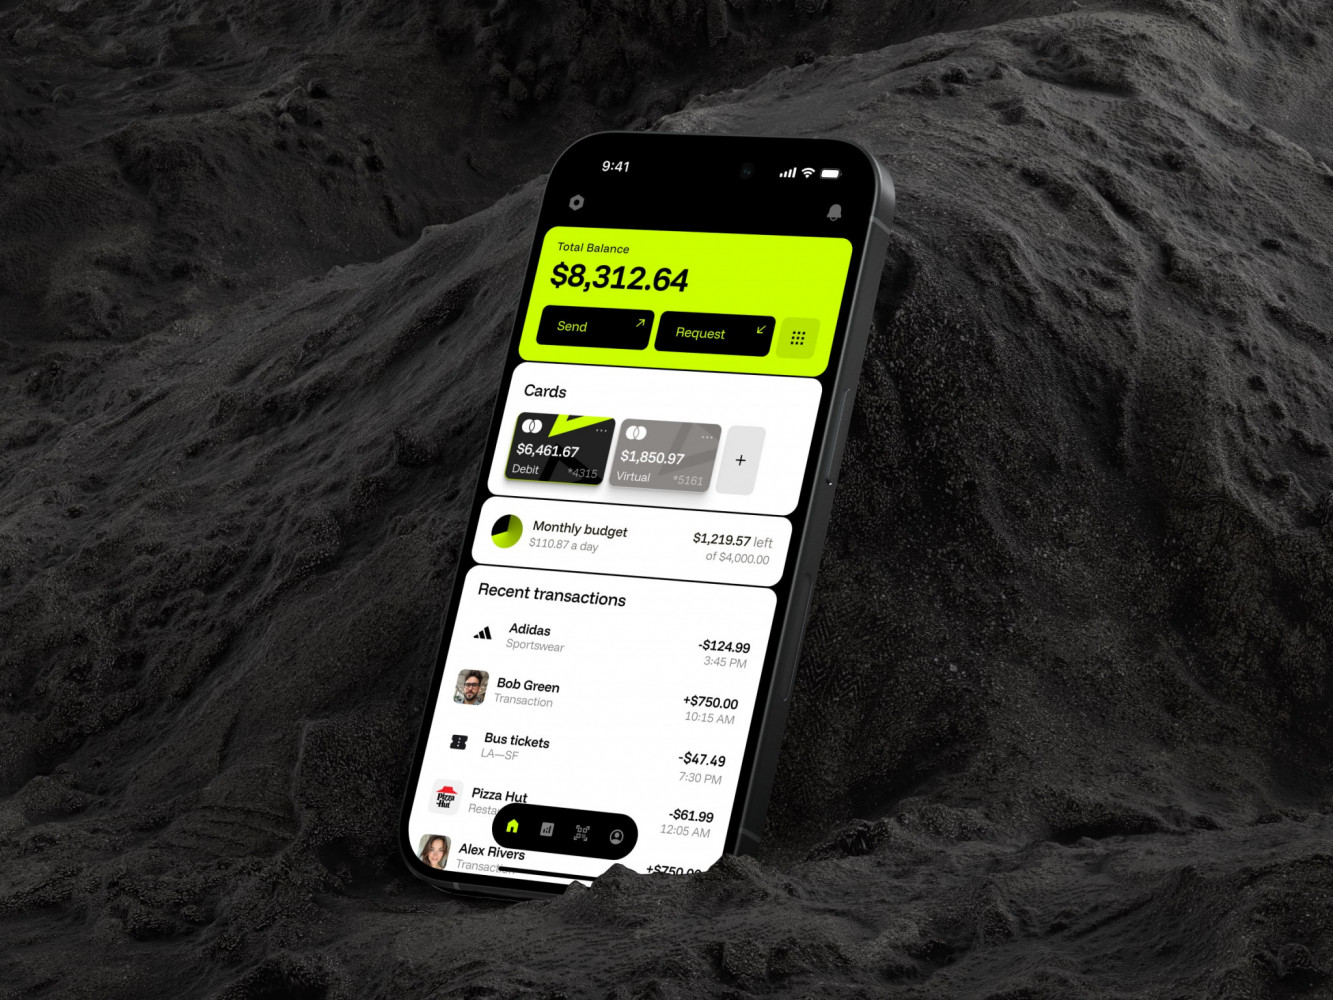
Mobile Banking App by Conceptzilla
Fintech Software Solutions
Fintech isn’t just one thing—it’s like an umbrella term covering everything from payment apps to blockchain platforms, lending systems, robo-advisors, and even fraud detection tools. It simplifies complex processes while keeping security front and center. And businesses have different needs. Small startups might need basic invoicing and expense-tracking features, whereas larger enterprises may require full-scale ERP integrations or AI-driven analytics.
Our expertise fits both directions. We develop personal digital wallets, management apps, investment platforms, and blockchain-based applications using robust technologies like Python, TypeScript, React JS, Next.js, etc. They offer high performance, scalability, advanced routing, and APIs, so the app can handle heavy data, as well as high traffic—two main challenges that financial software faces. Not to mention easy-to-grasp analytical tools that provide real-time, essential information for making relevant decisions. And thanks to the technologies, they aren’t clunky but sleek and pleasing to the eyes.
Fintech is about improving lives. With custom financial software development, you give a power-up for your digital services and assist users in reaching their financial goals.
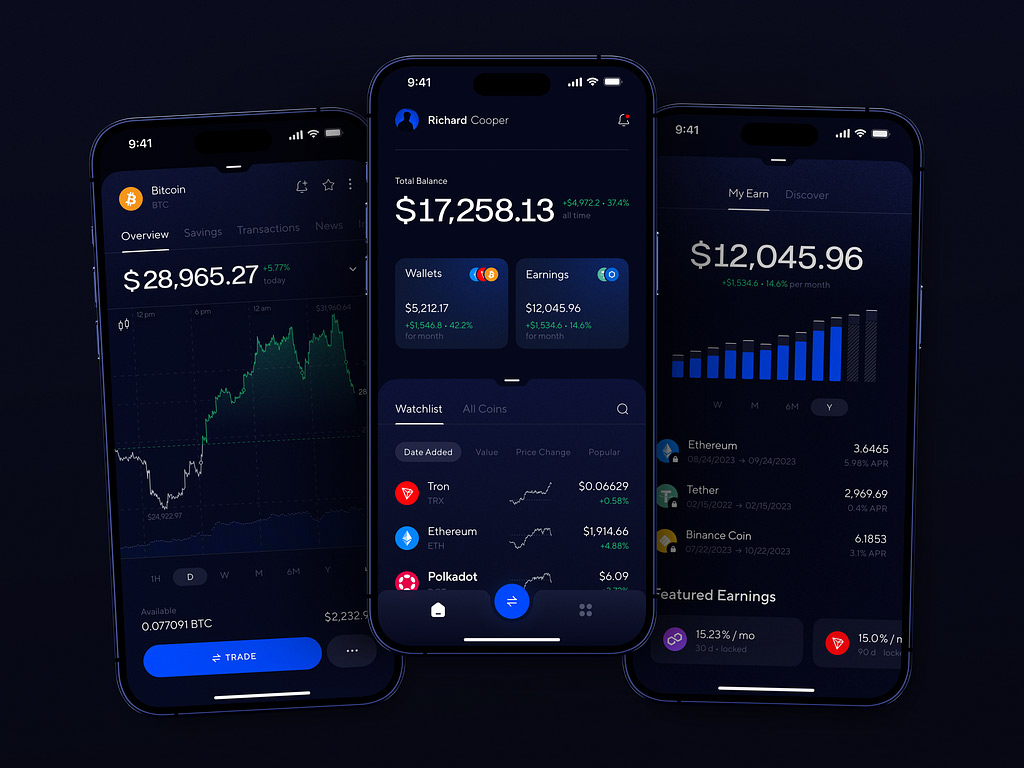
Abyss Crypto Management App by Conceptzilla
Financial Data Management Systems
This is all about building software that enables companies to gather, store, analyze, and secure their financial data. These platforms can be as simple as dashboards that provide a snapshot of your accounts or even be complete enterprise-grade platforms that can manage millions of transactions in multiple currencies. The kind of thing that keeps CFOs awake at night (or sleeping better, depending on how good it is).
The data management systems integrate well with other tools. Think about it: banks, investment firms, insurance companies—they all use tons of different software every day. A good system doesn’t just sit there by itself; it connects seamlessly with accounting software, CRM platforms, reporting tools, and more. That level of interoperability really helps streamline workflows.
Reliability is another must-have quality. Like, imagine logging into your system one morning only to find it crushing because of a high load. Not fun, right?
To achieve all of these goals, the team should have a robust backend. Our team uses Python and .Net for server-side development, along with Ruby on Rails technologies. With this foundation, we build secure and scalable custom financial services software for accounting, budgeting, and financial reporting.
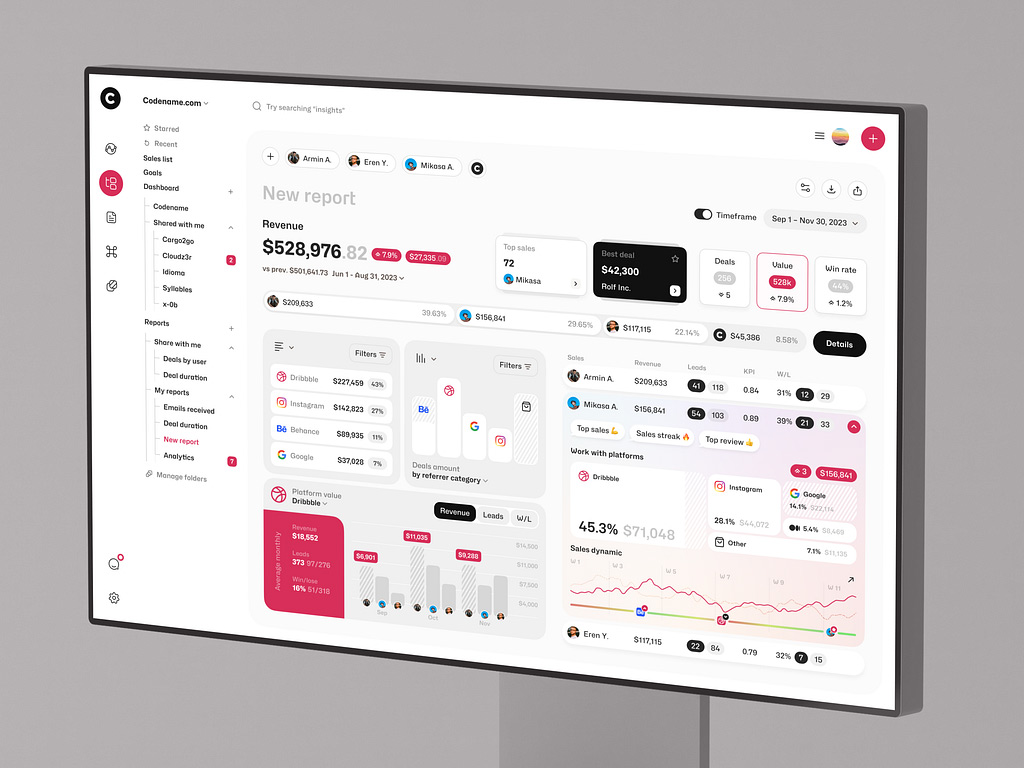
Another thing that I have noticed is more automation in handling financial data. AI and machine learning are assuming bigger roles, especially within categories like predictive analytics and anomaly detection. For example, instead of wasting time combing through reports to identify errors, an intelligent system can automatically flag suspicious patterns. Saves time, reduces human error, and frankly, makes life easier. Who doesn’t want that? That’s why we also integrate AI into financial analytics: it speeds up the decision-making and gives the contextually appropriate background information instantly to make the results better.
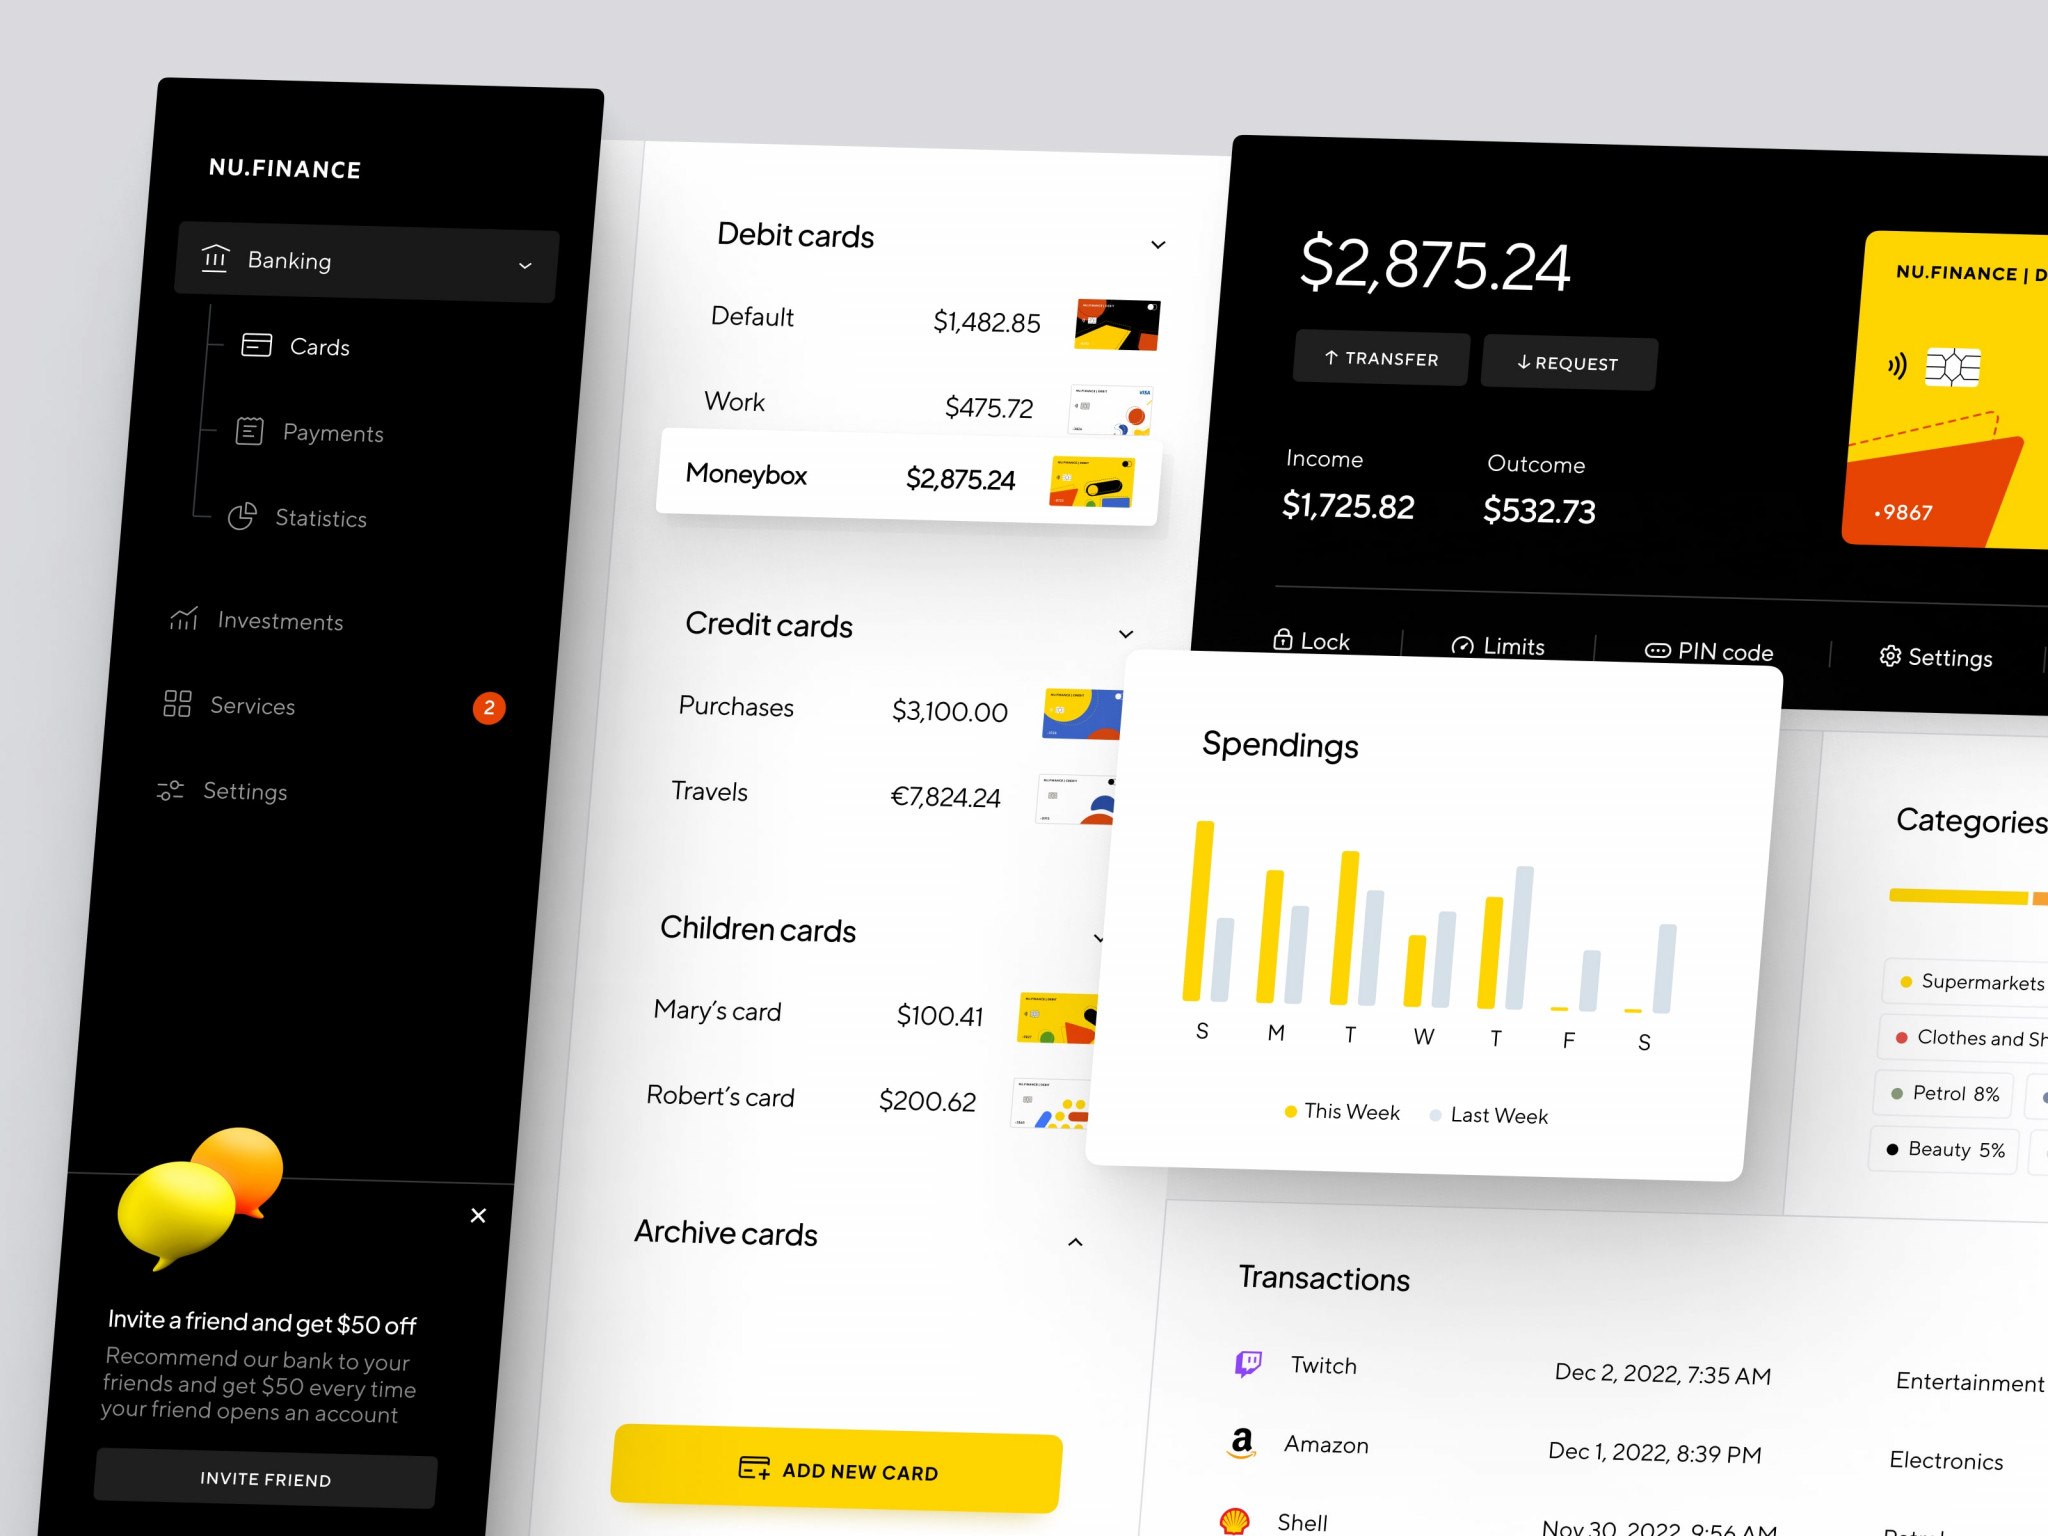
Dashboard Design for an Analytics Tool by Shakuro
Low-Code Financial Solutions
If you’ve ever worked in finance or around fintech, you know how much time and effort goes into taking a custom approach. For those who aren’t familiar, low-code development is all about simplifying the process of building apps with drag-and-drop interfaces instead of writing endless lines of code. Again, just like Lego blocks for software (too many Lego comparisons, huh?). You don’t need to be a coding wizard to piece things together—you just need to understand the basics and have a clear idea of what you want to build.
Low code accelerates the creation of custom financial services software, making it cheaper, faster, and more accessible without sacrificing value where it matters. And in finance, where speed and agility are paramount, that’s a changer. Even on a tight timeline, you receive a well-designed product with value for the end-users. This makes these solutions perfect for startups and companies who want to move time-to-market faster.
One of my favorite things about low-code platforms is how rapidly you can iterate. You deploy a new app to your team, and a week later, they’re returning complaining: “Hey, this feature would be great if we could do some tweaks.” With traditional development, doing those tweaks can take weeks or months (mental health wasted included). But with low-code? You are typically in a position to make changes in hours. That responsiveness is massive, especially in sectors like finance, where market and regulatory conditions are constantly shifting.
As a banking software development company, we use Webflow to build responsive and functional apps or websites for various needs. It’s faster than traditional methods, scalable, and cost-efficient. With the rapid development, it still brings valuable features that help your target audience. And brings value to your business.
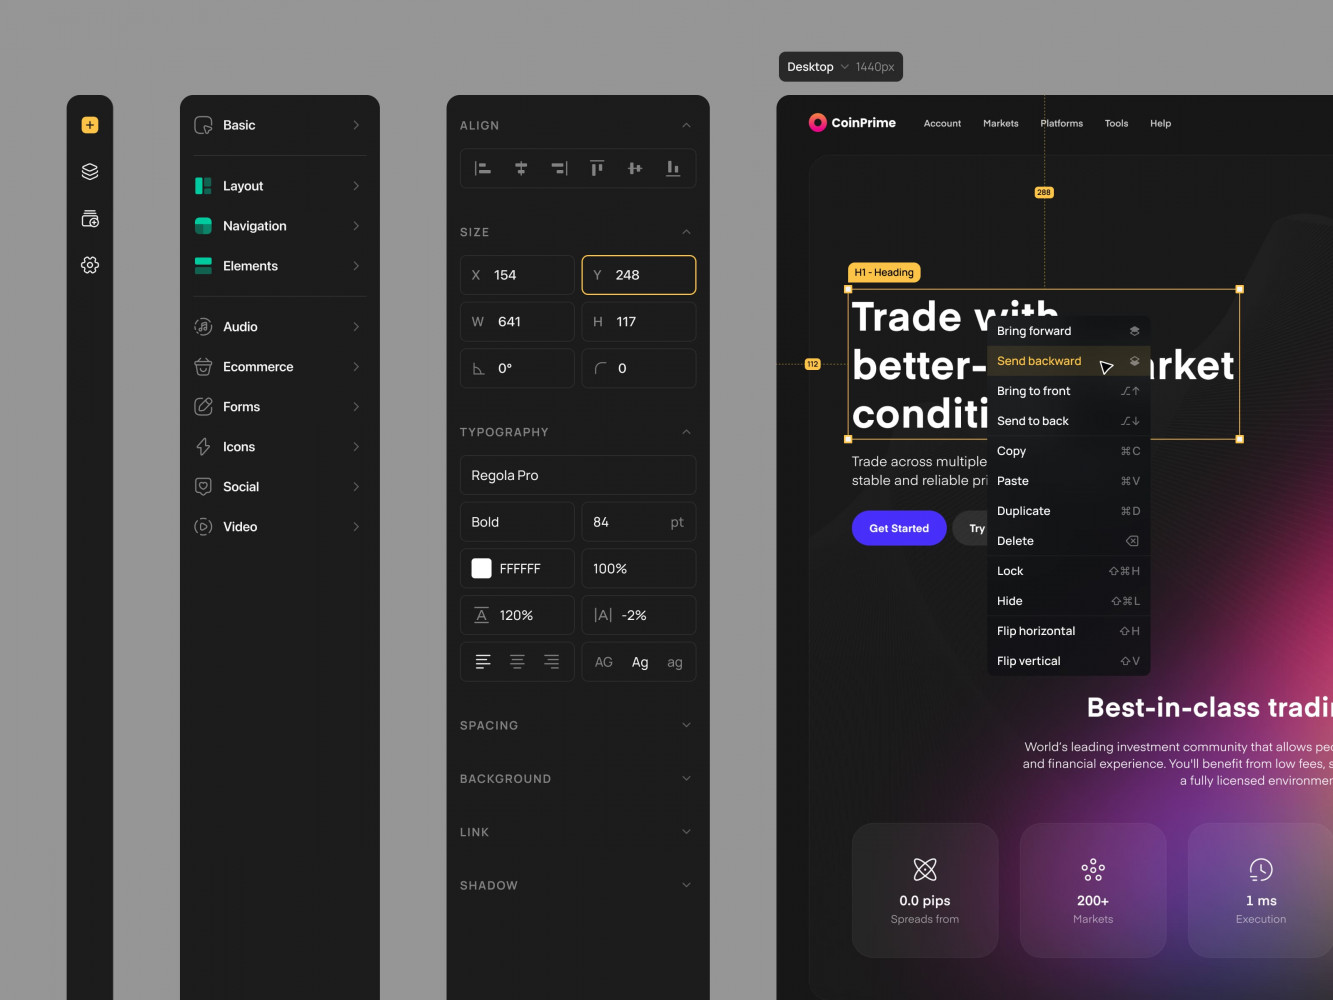
No Code Constructor Dashboard Design by Conceptzilla
Industries We Serve
Our financial software development services can be applied in various industries. I’ve already mentioned a couple above, but I’ll give a full list this time for your convenience.
- Fintech: The name says it all. We integrate custom solutions to create personal finance apps, expense management apps, digital wallets, payment gateways, etc. They are secure, reliable, and can deal with high data traffic. Unlike traditional approaches in banking software, fintech relies on fresh perspectives in the industry like automation with AI. Robo advisors, for instance.
- SaaS: Cloud-based financial platforms. They are more complex than personal digital wallets. Quite often such platforms offer professional tools, for example, predictive analytics. We implement comprehensive analytical features and glanceable dashboards powered with AI, so pro-level investors have an easier time making important decisions. Not to mention a high level of security too, of course.
- E-commerce: Shopping shifts into digital space, so payment processing and financial analytics are integrated into various web platforms, ranging from shopping to e-learning. Apart from security, smooth operations, and responsiveness, our teams spice the products up with personalized recommendations, AR features, virtual assistants, inventory management, etc.
- Web3: Edge computing, AI integration, and decentralization are the pillars of Web3. It makes the web experiences completely transparent, so the way services work here is different. The direction is relatively new, but our team has quite a lot of experience developing decentralized finance (DeFi), blockchain, and cryptocurrency solutions. We deliver accessible products that have educational value and engage communities to use the app more. To improve decision-making processes, we integrate AI features like risk assessment and credit scoring.
Key Benefits of Custom Financial Software Development
Well, having been around the block a few times in this area myself, I can tell you that fintech is not so much about possessing something new and bleeding-edge. It provides advantages to the users and to your business such as simplifying processes and getting ahead of the competition. But also:
Developed Specifically for You
I’d compare off-the-shelf to purchasing a suit off the rack. Yes, it will probably work okay, but it won’t be perfect. Custom financial software, on the other hand, is like having a tailored suit—it fits you perfectly. Maybe you need to have certain kinds of reports, integration with legacy systems, or workflows that suit your team’s style. With a custom solution, you get exactly what you need without having to sacrifice or make a one-size-fits-all solution fit. Believe me, such precision is a make-or-break matter.
Products That Grow With You
I believe one of the biggest things that I have observed companies face is outgrowing their software. Consider the fact: you’re spending in on a piece of software that runs great today, but with an increase in business, starts lagging in processing. A banking software development company considers scalability. You need, say, a payment processor system for your website, for example. Initially, you will be handling a few hundred a month, but a year from now if business keeps growing, you will be handling thousands a day. A system customized will scale with you with ease without needing you to rip the whole thing out and rebuild. Sorta of vision for the future that saves time, money, and agony later.
Improved Security
This is huge in the finance world. Pre-made solutions have weaknesses that hackers adore exploiting—you’re utilizing the same software as tens of thousands of other businesses, so if there’s a vulnerability, everyone’s at risk. Custom software lets you design security features just for your requirements. Multi-layer encryption, role-based access controls, and real-time monitoring—those sorts of things. And because the code isn’t all over the place, it’s less likely to be targeted by opportunistic attacks. Peace of mind? Absolutely.
Cost Efficiency in the Long Run
I’m sure you’re thinking: “Financial software development services are expensive.” And yes, upfront costs will be higher than off-the-shelf solutions. But it’s typically cheaper in the long run. Why? Because you don’t pay annual licensing fees, features you don’t need that you’ll never use, and the constant aggravation of workarounds. And when your software is tailored to your business, it eliminates inefficiencies and boosts productivity. Over time, those savings add up. I’ve seen companies recoup their initial investment within a couple of years, sometimes even sooner.
Regulatory Compliance
Financial regulations are a beast. They change frequently, vary by region, and can be incredibly complex. Trying to adapt generic software to meet specific compliance requirements is often like trying to shove a square peg into a round hole. But a financial software development company can produce a product that has compliance ingrained in it from the ground up. Have to meet GDPR, SOX, or PCI DSS standards? No problem. You can get your system compliant with whatever standards are required without having to go through hoop-jumping gymnastics. I promise you, auditors will thank you—and so will your team.
Ownership and Control
When you buy off-the-shelf software, you’re essentially renting it. The vendor controls updates, pricing, and even whether the product is still available on the market. With a custom solution, you’re in control. Period. That means you get to choose when and how to update it, add new features, or modify its functionality. You’re not tied to a third-party provider. In my own experience, that level of control is actually very empowering, especially for businesses that rely on their programs for daily use.
Sales Analytics Dashboard by Shakuro
Our Success-Driven Approach
If you’ve ever wondered how these different types of projects come together in our halls, it’s not just about writing code and calling it a day. There’s a structured process behind the scenes that ensures the final product meets your needs, performs well and stands the test of time.
The basic process of custom financial software development looks like this:
Discovery and Planning
This is where the magic begins—or at least where the foundation is laid. Just like mapping out a road trip: you wouldn’t get in the car without having a destination, right? The same with development.
The first step we take is sitting down with you and understanding what you’re really hoping to achieve. What are your pain points? What is success to you? Are there specific workflows or features you need absolutely? This is the questioning phase. The more that we know, the better the outcome.
Now that we know what you need, the next part is planning how to get there. Think about this: constructing a plan for your home—you wouldn’t start building without having an idea of where to place the walls, right? A roadmap for a project outlines timelines, milestones, resources, and deliverables. It keeps everyone in sync and sets reasonable expectations.
Something I love so much about this stage is seeing the “aha” moments clients have when they get how it all ties together. It’s like watching someone put the pieces together in front of you. Also, having a solid roadmap prevents scope creep from occurring later on—because let’s be real, feature requests always seem to pop up out of nowhere while in development.
Design and Development
And then we arrive at the fun part: turning ideas into reality.
Here’s the thing: however cool your custom financial services software is, if customers can’t get through it, it’s for naught. Which is why design matters so much. We focus on building interfaces that are easy to use, look nice, and optimized for your constituents. Whether internal staff using your systems for routine work or clients working on your platform, everything should feel effortless.
Then we transition high-fidelity designs into code. If you’ve heard of Agile before, you probably know it’s all about being flexible. Instead of committing everything to stone up front, we work in sprints. Each sprint delivers a block of functionality that’s tested and iterated on before moving on to the next. This allows us to stay agile—if priorities shift or new information surfaces, we can quickly change direction.
Testing and Deployment
Before anything goes live, it has to go through rigorous scrutiny.
Testing is non-negotiable. Period. Consider rolling out a payment processing system and discovering it locks up under high traffic or leaks sensitive data. Worst-case scenario, right? That’s why we test aggressively—for bugs, vulnerabilities, performance bottlenecks, and compliance issues.
Deployment is like opening night at the theater—you want everything to function flawlessly. We roll it out carefully, be it a phased deployment or a full-frontal deployment, to minimize disruption. Once live, it’s far from over. Post-launch support is crucial for addressing any teething issues, training users, and feedback for future development.
Technologies We Use
Tools are as important as the expertise itself. How can one build a house without proper instruments? Same here, developers need special software to bring your idea to life. I’ll name only a few tools that our teams use for custom banking software development.
- Frontend: React, Angular, TypeScript, and Next.js. With their help, we deliver flexible and scalable complex applications enriched with content. Thanks to optimized performance, the toolkits are robust enough to face data overload in financial apps. Also, these frontend technologies have an established ecosystem, so it’s easy to find pre-built components. Speeds up the development, by the way.
- Backend: Ruby on Rails, Python, Flask, and FastAPI. These solutions are fast, cost-effective, and flexible, with a lean codebase. For additional resilience, we use cloud services and integrate Python language into different databases.
- Blockchain: Ethereum and Hyperledger for decentralized solutions.
- Cloud: AWS and Azure for scalable infrastructure. We choose them for functionality, affordability, and adaptability. Using them, our team works beyond surface-level improvements and builds apps that ease people’s lives.
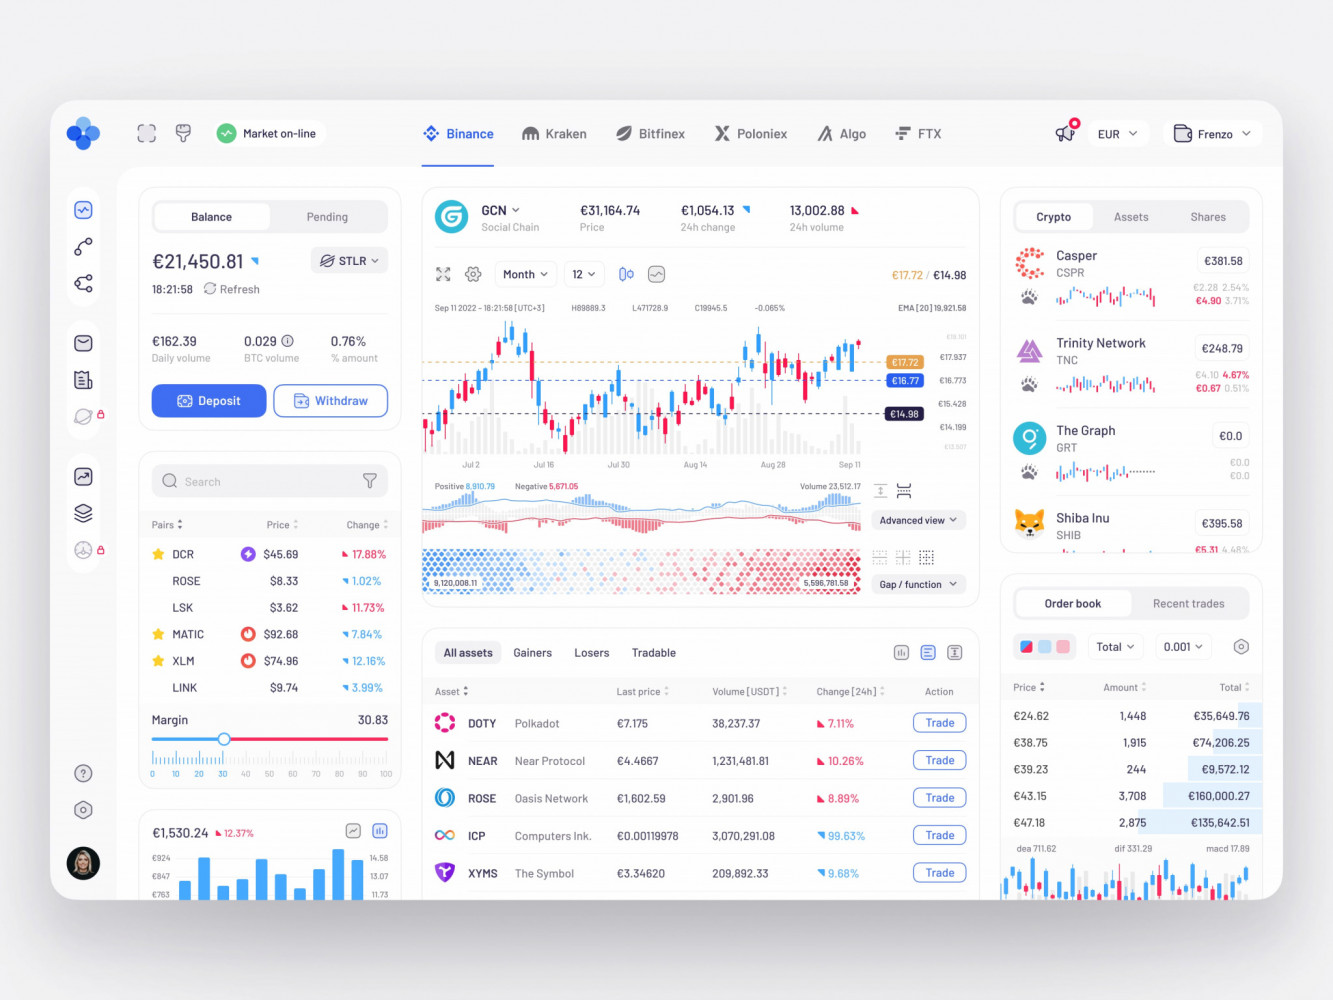
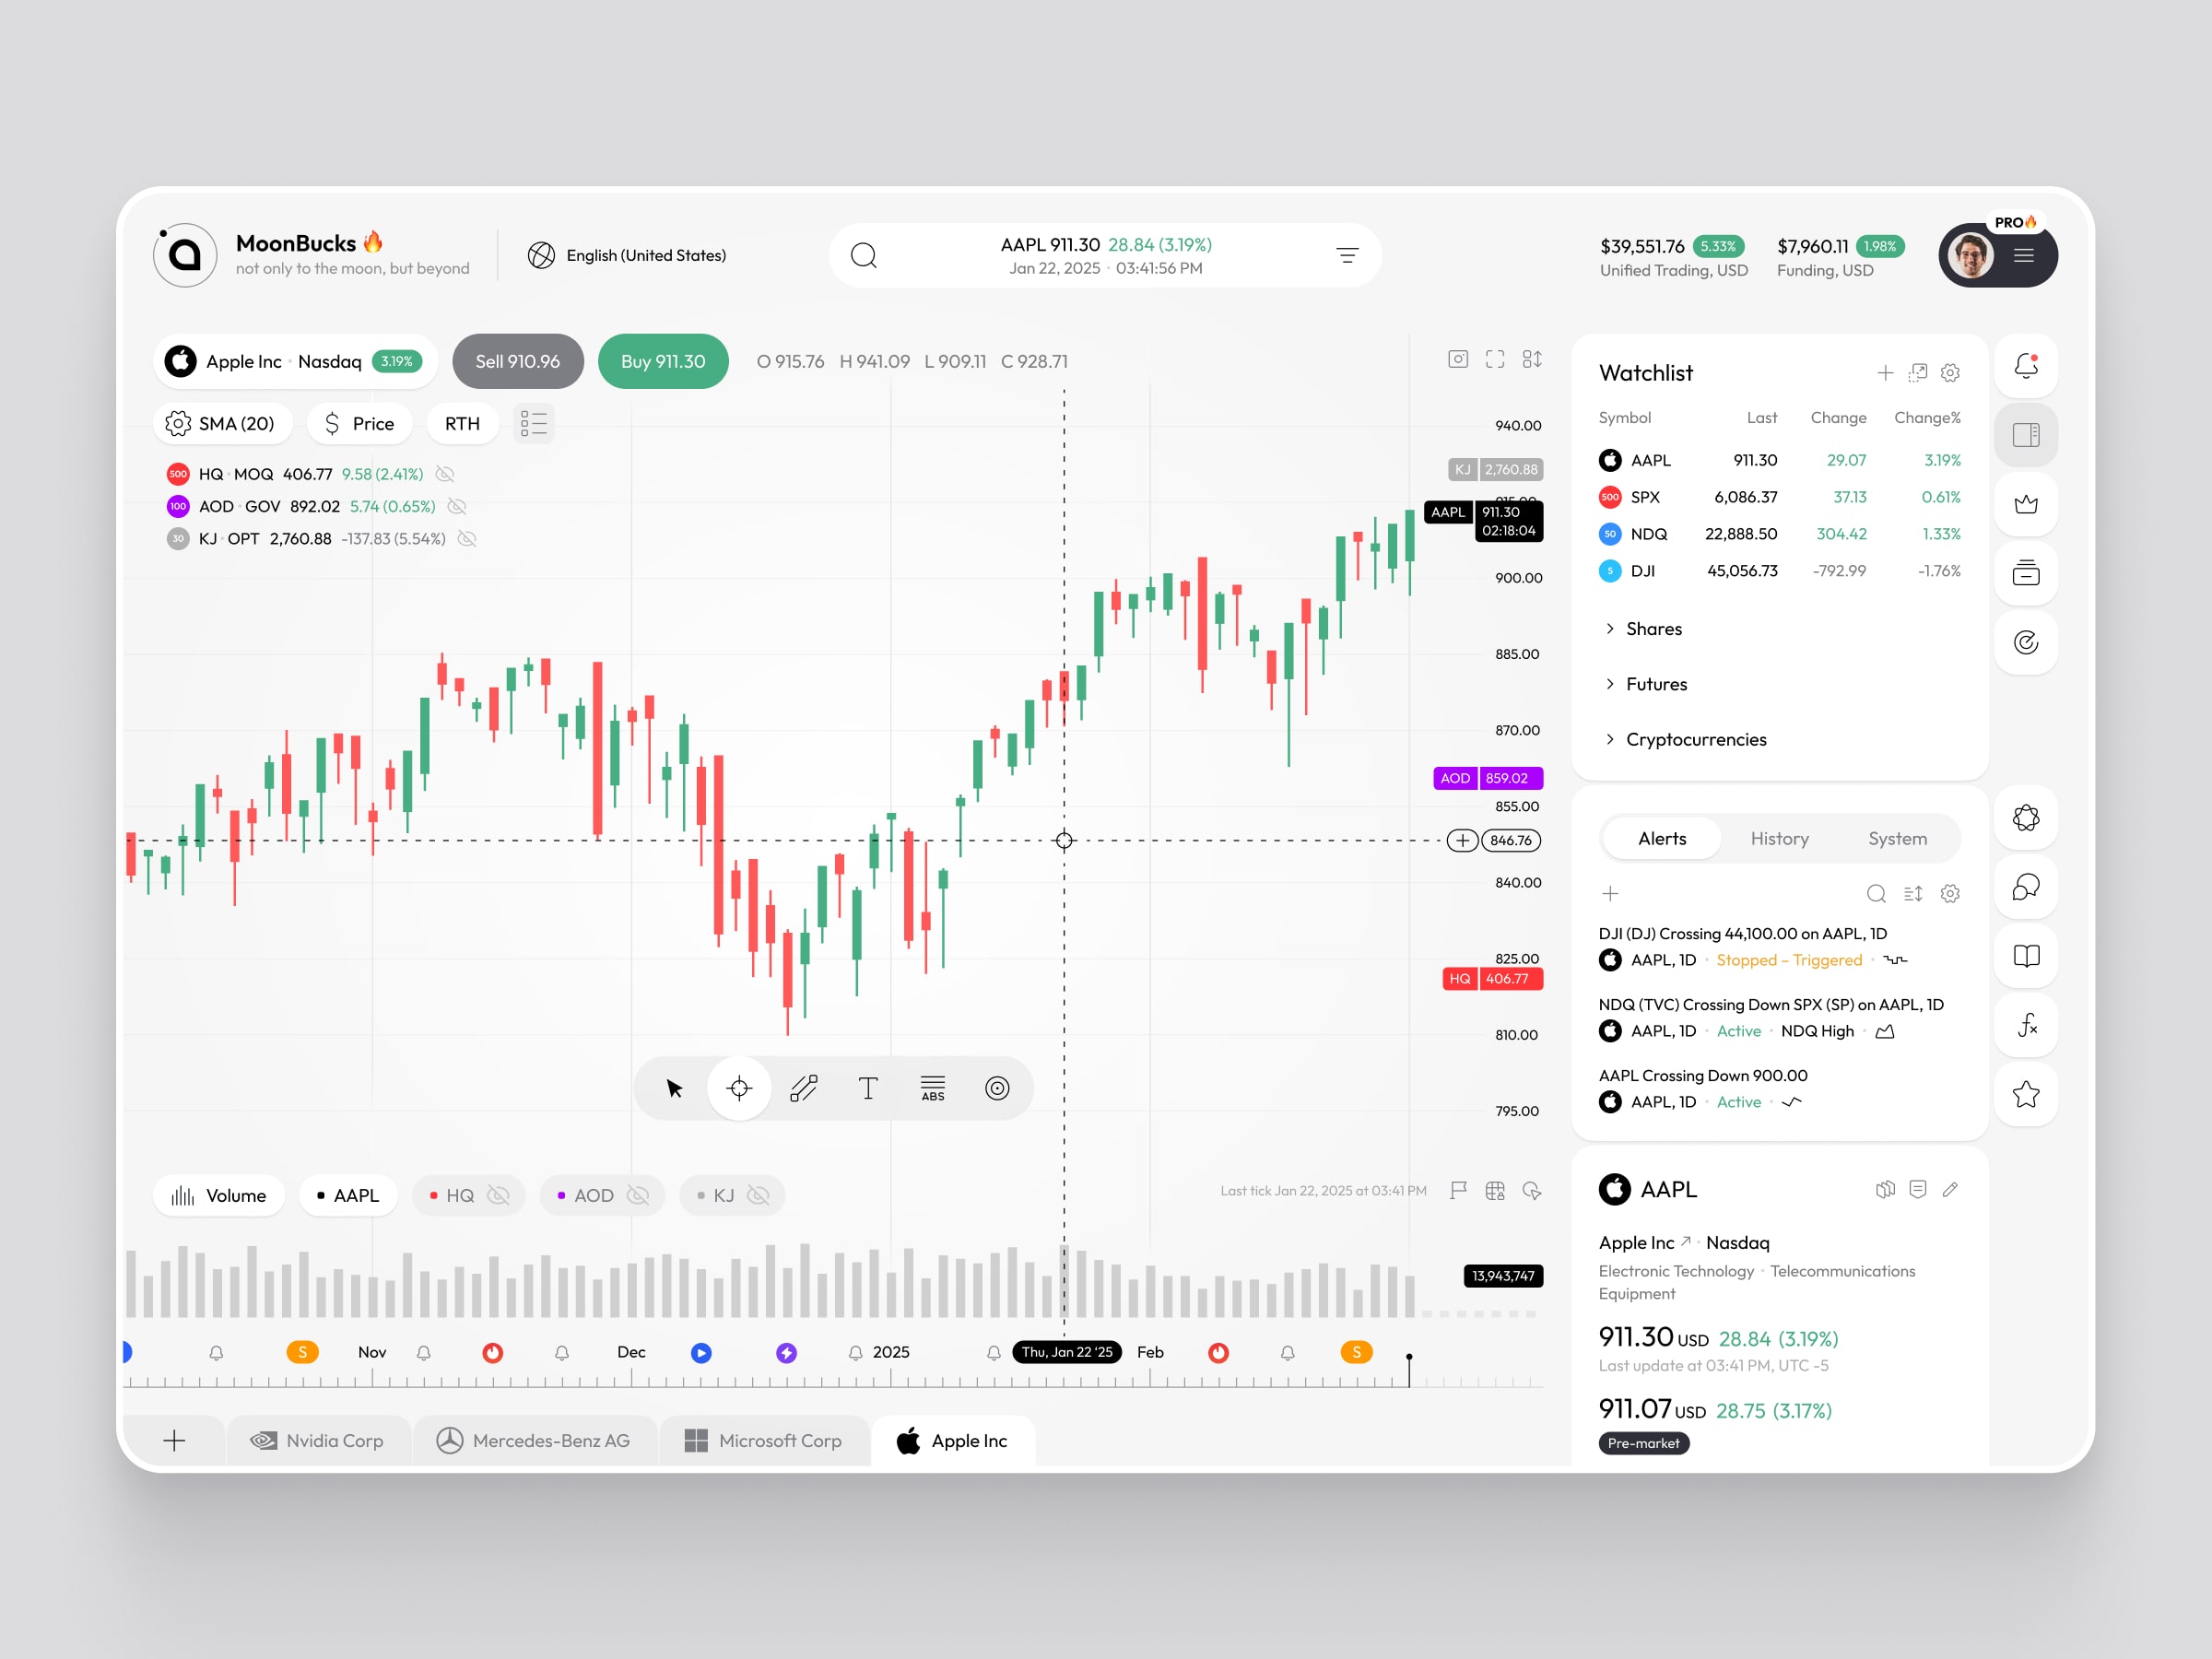
Crypto Trading Dashboard Design by Conceptzilla
How to Get Started
So, if you want to work with us, how do you do it? Well, the process is very simple.
Contact Us
This is where you take the leap. You complete the application, book a call, or send an email—and really, it’s fine if you’re not quite sure about all the details at this point. What you do want to do here is just start the conversation. Bring your high-level concept, the problems you are trying to solve, and whatever specific features or goals you have in mind at this point.
I’ll be honest, this section does seem quite intimidating at first. Don’t fret too much. We’re used to working with clients who are still developing their concepts. In fact, one of the most positive aspects of this stage is helping people to define their needs.
Oh, and a hint: be as realistic as possible in terms of your timeline and budget. It’s easier for us to tailor financial software development services to fit your reality. No need to beat around the bush—it’s always best to clear expectations first.
Get a Proposal
When the development team is sure of what you require, we work up a proposal. Now is the moment of truth. The proposal includes:
- A master plan: What will be built, with descriptions of features and functionality.
- A schedule: How long each stage of the project will take.
- An estimate of cost: A breakdown of the investment made.
Now, don’t just read through this document. Read it carefully and ask questions if something doesn’t make sense. Yes, it’s a pain, but it can be that some features can be left out of the initial scope. That’s why it’s so important to get into the details early on, when changes are simple to implement.
Start Development
Okay, the proposal’s signed, and you’re ready to roll. Now comes the exciting part—actually building your software. This is where collaboration becomes key. You’re not just handing over a list of requirements and walking away; you’re actively involved in shaping the outcome.
We keep you updated from time to time on progress, ask for feedback, and remain on course. Since we are working under Agile methodology, you get frequent catch-ups or sprint reviews where you receive incremental progress and can offer feedback.
One advice: be open to accepting ideas from the development team. They’ve already done it, and they may come up with something that you may not. It’s a two-way street—a collaboration of your skills and theirs to create something amazing.
And don’t worry if it doesn’t all go without a hitch perfectly from the get-go. Custom financial software development is always going to be an iterative process. There will probably be changes, tweaks, and maybe even some surprises along the way. But that’s okay! The important thing is to be flexible and maintain open channels of communication.
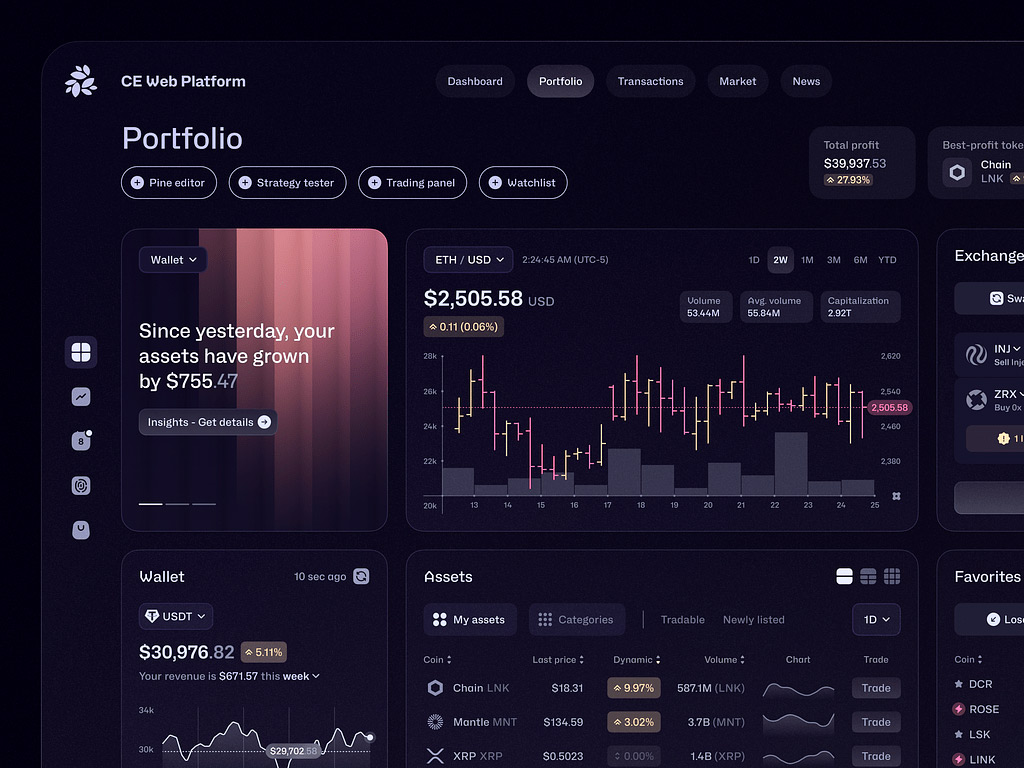
Crypto Exchange Web Platform by Conceptzilla
Conclusion
This sphere isn’t just about creating tools—they’re about solving real problems, driving efficiency, and giving businesses a competitive edge.
A custom approach ensures that the solution fits your unique needs like a glove. Off-the-shelf options might work for some, but if you’re looking for something that truly aligns with your goals, adapts to your workflows, and grows with your business, custom financial software development services are the way to go.
If you are working with the right development team, the process is no longer a headache but rather an exciting experience towards transformation. You, our business partner, will end up with a stable and scalable financial product that meets your needs and caters to the needs of the users.
So what do you do next? Are you ready to make your next step in developing software that works as hard as you do? We can help. Get in touch and let’s discuss your project—we’d love to hear what you’re thinking of and tell you how we can make it possible. Because the best solution starts with a conversation.
Frequently Asked Questions
What is the cost of custom financial software development?
It’s not a one-size-fits-all solution. The price depends on a lot of variables, including the complexity of your project, what functionality you need, and how much customization is needed. It can be $10,000 for a simple app or jump to $200,000 and more for a large business. So if you’re willing to see what can be accomplished, let’s discuss for a better idea of what your project might cost.
How long does it take to develop financial software?
The time frame depends on too many moving parts, e.g., how big your project is, what features you are aiming for, and the level of customization needed. On average, the app will take 2–6 months, but if the project is a tough one, the time needed may be up to a year or two.
Do you ensure compliance with financial regulations?
Yes, as a financial software development company, we are in accordance with GDPR, PCI DSS, KYC, and other corresponding rules according to the country. Anticipatively, prior to initiating the development procedure, the team learns extensively concerning the market as well as the legislations demanded.